


MCTB
142
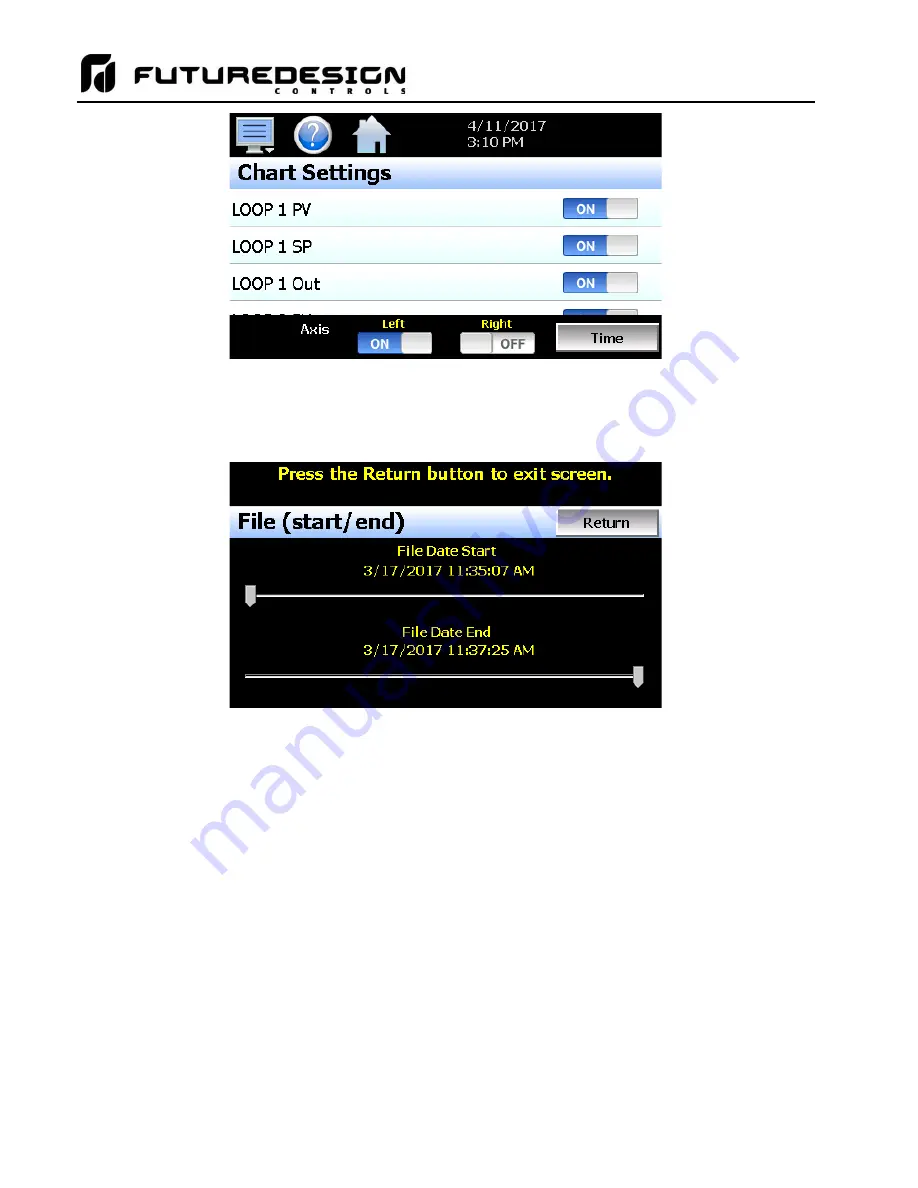
Any point from the data file can be selected along with the vertical axis to be used for each channel to be plotted.
Select channels from the list by turning them on or off and use the
“Left” and “Right” axis buttons to assign the
selected item to the left or right axis for the plot range. To adjust the period of time to plot from the data file,
press the “Time” button.
The start and end dates for the currently loaded file will be shown with time in hours, minutes and seconds.
The
“File Date Start” and “File Date End” sliders are used to select a time span for historical viewing. Once the
desired start and end times have been set, press the
“Return” button to return to the Chart Settings screen.
8.3.2
Plotting Historical Data
The history Chart plots the data from the currently opened history file according to the selections made under
chart setup. If a file has not been opened or data points have not been assigned to a plot, the MCTB will alert
the user to correct the problem.
The ‘X’ and ‘Y’ axis scales are set to auto scale based on current values for
each plot channel so no user action is required.
The historical graph provides the same zoom feature as the real-time charts so the user can zoom in on a
particular area of the historical plot by dragging their finger across the screen to draw a rectangle around the
desired plot area.
Содержание MCTB 4.3
Страница 24: ...MCTB 24...
Страница 195: ...MCTB 195...
Страница 227: ...MCTB 227 A 5 SmartIO Monitor Module Specifications...
Страница 228: ...MCTB 228 A 6 Expansion IO Module Specifications...
Страница 229: ...MCTB 229 A 7 Power Supply Specifications DIN Rail Mount Power Supply Specifications...
Страница 230: ...MCTB 230...
Страница 231: ...MCTB 231 Open Frame Power Supply Specifications...
Страница 232: ...MCTB 232...
Страница 233: ...MCTB 233 A 8 Power On Delay Relay Specifications GE1A C10HA110...
Страница 234: ...MCTB 234...


