Viewing Predefined EPICenter Reports
EPICenter Software Installation and User Guide
387
Event Log Report
To view an Event Log Report, click the Event Log link in the left-hand panel. This displays a report of
all the entries in the EPICenter Event Log. The information reported includes:
• Event #
—Event ID of the event (assigned by the EPICenter server when the event is received)
• Count
—Number of consecutive events (if the same trap occurs at the same time and is received
multiple times, only one event is created and the count displays the number of traps)
• Time
—Time the event occurred (local time of the EPICenter server)
• Source
—IP address of the device and port number (if applicable) that generated the event
• Type
—Event type (for example, SNMP Trap)
• Varbinds
—Variable data transmitted with a trap
The event information is displayed in groups of 25 events per page. You can navigate among the pages
using any of the following methods:
•
Clicking the Previous and Next links
•
Selecting a page number from the at the top of the report
•
Clicking the First or Last links to display the first or last page in the report
Click the heading of a column to sort on the contents of that column.
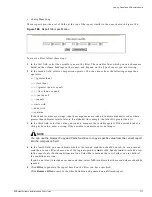
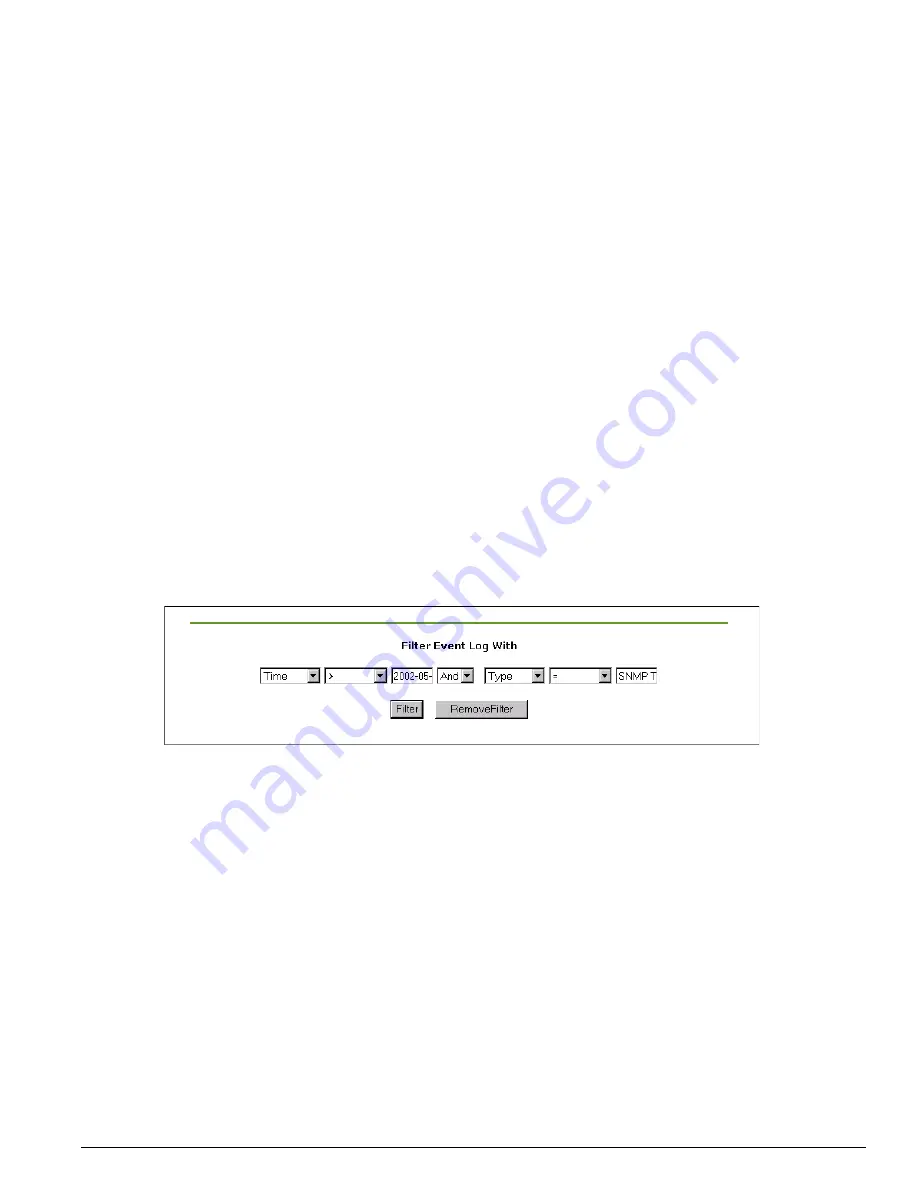
You can filter the events that are displayed by constructing a conditional filter using the fields at the top
of the page, as shown in Figure 190. This lets you construct a two-clause filter statement.
Figure 190: Event Log filter specification
You can filter on any of the variables shown in the report.
You can use the browser Copy and Paste functions to copy a specific value from the current report into
the comparison field. This is particularly useful if you want to filter on a specific Varbinds value.
System Log Report
To view a System Log Report, click the Sys Log link in the left-hand panel. This creates a report of all of
the entries in the System Log. The information displayed includes the following:
• Event #
—Event ID of the syslog entry (assigned by the EPICenter server when the syslog is received)
• Time
—Time the syslog is received by EPICenter (local time of the EPICenter server)
• Source
—IP address of the device that generated the syslog entry
• Facility
—Syslog facility field
Содержание EPICenter 4.1
Страница 20: ...20 EPICenter Software Installation and User Guide Preface ...
Страница 46: ...46 EPICenter Software Installation and User Guide EPICenter and Policy Manager Overview ...
Страница 190: ...190 EPICenter Software Installation and User Guide Configuration Manager ...
Страница 204: ...204 EPICenter Software Installation and User Guide Using the Interactive Telnet Application ...
Страница 242: ...242 EPICenter Software Installation and User Guide Using the IP MAC Address Finder ...
Страница 266: ...266 EPICenter Software Installation and User Guide Using ExtremeView ...
Страница 284: ...284 EPICenter Software Installation and User Guide Real Time Statistics ...
Страница 436: ...436 EPICenter Software Installation and User Guide Using the Policy Manager ...
Страница 454: ...454 EPICenter Software Installation and User Guide The ACL Viewer ...
Страница 468: ...468 EPICenter Software Installation and User Guide Troubleshooting ...
Страница 504: ...504 EPICenter Software Installation and User Guide EPICenter External Access Protocol ...
Страница 510: ...510 EPICenter Software Installation and User Guide EPICenter Database Views ...
Страница 522: ...522 EPICenter Software Installation and User Guide EPICenter Backup ...
Страница 526: ...526 EPICenter Software Installation and User Guide Dynamic Link Context System DLCS ...
Страница 546: ......


