2.3 Displaying data on a computer terminal
The flow rate data collected by the XGF868i may be displayed in various formats on a remote computer terminal via the
meter’s RS232 serial port. This requires the use of the optional PanaView software. Refer to the instructions below to display
data via PanaView.
2.3.1 Preparing for PanaView programming
Before you attempt to communicate with the XGF868i, be
sure you have linked your PC to the XGF868i via an RS232
interface. For details on wiring the interface, refer to
Wiring
the serial port
in the
Startup guide
, and to the document
EIA-RS Serial Communications
(916-054). You must also
install PanaView, as discussed in the
PanaView user’s
manual
(910-211), and in
Appendix C, Programming the
XGF868i via PanaView™
.
1. Power up the XGF868i and wait until it has initialized.
2. Launch PanaView and wait until it initializes the XGF868i
and displays the basic PanaView window.
3. As described in
Appendix C
, open the
meter browser
window and highlight the meter to be used.
At this time, any of PanaView’s comprehensive data
handling capabilities may be used. These include:
• Collecting and displaying live data in text format
• Collecting and displaying live data in graphical format
• Collecting and logging live data
• Displaying a log file in text format
• Displaying a log file in graphical format
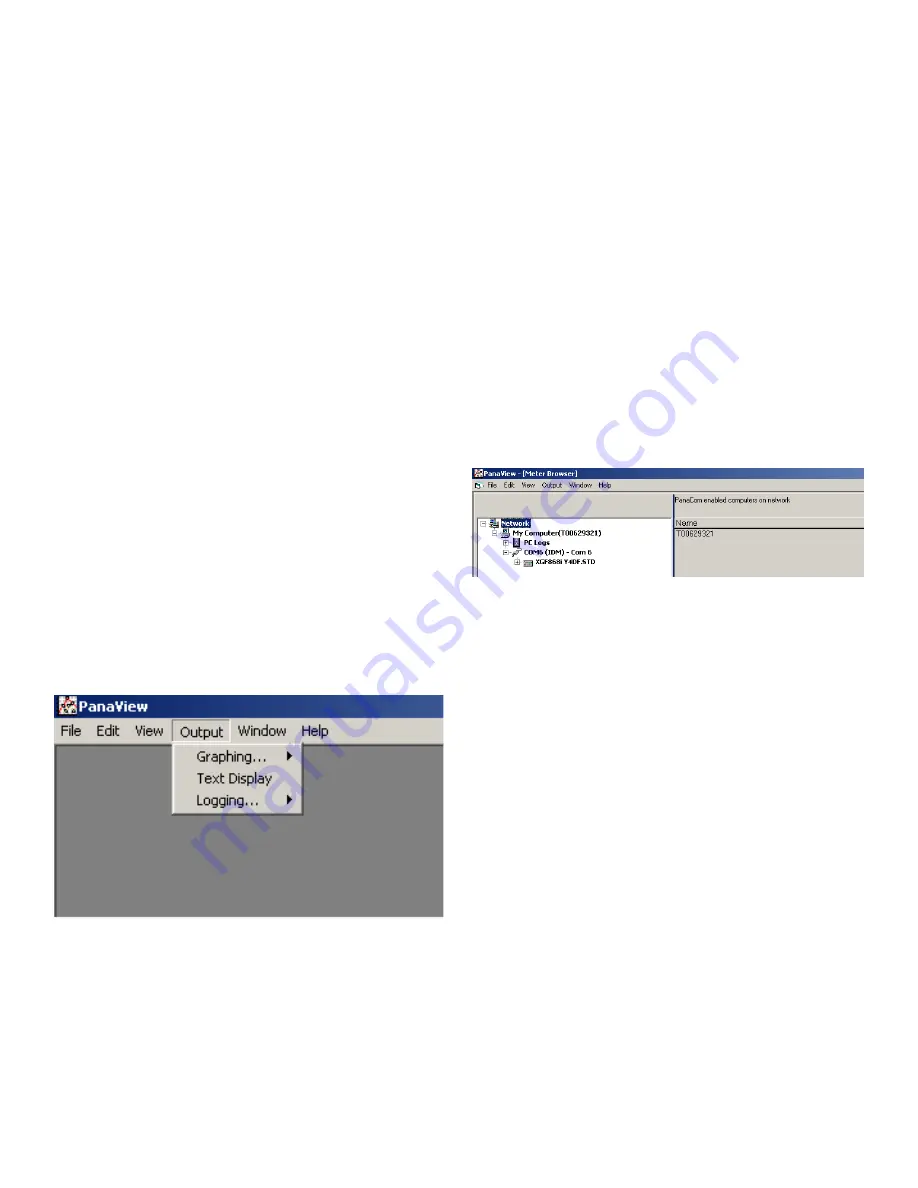
To access PanaView’s data handling options, pull down the
output menu
, as shown in
Figure 2
below.
Figure 2: Output menu
Proceed directly to the appropriate section for instructions
on either of the following output options:
•
Text display
output, discussed below
•
Graphing the output on page 25
NOTE:
For information on the
logging
output, see
Chapter 3,
logging data
.
2.3.2 The text display output
To collect data from the instrument and display it on a text
screen, complete the following steps:
1. Complete steps 1-3 on the previous page.
2. Pull down the
output
menu and click on the
text display
option. See
.
NOTE:
The
text display
window that appears after step 2 is
actually stacked on top of any previously opened windows
(such as the
meter browser
window).
3. Using the window menu, arrange the open windows
in the desired format. For this discussion,
Figure 3
below shows the
text display
window in its maximized
(full-screen) size.
Figure 3: Text display window
NOTE:
Figure 3
above has been compressed both vertically
and horizontally for improved clarity.
4. The left pane of the
text display
window contains the
standard PanaView network tree. Expand this tree as far
as necessary, and double click on the desired process
parameter to display it in the right pane of the window.
5. Before actual data values can be displayed in the text
pane, activate one of the following data collection
modes (refer to
• Click on the [get once] option button at the bottom of
the right pane in the
text display
window. The current
value of the selected process parameter, as specified
in the PanaView network tree, is displayed in the right
pane of the
text display
window.
or
• Enter an
interval
in the text box at the bottom of the
right pane in the
text display
window, or check the
max. comm rate
box to collect readings as fast as the
system allows (1 sec). Then, click on the [continuous]
option button to begin collecting data for display in the
right pane of the
text display
window.
NOTE:
Any value entered in the
Interval
text box is overridden
if the
max. comm rate
box is checked.
24
Содержание DigitalFlow XGF868i
Страница 1: ...DigitalFlow XGF868i Panametrics flare gas flow transmitter Programming manual...
Страница 2: ...ii...
Страница 4: ...no content intended for this page iv...
Страница 10: ...x...
Страница 38: ...28...
Страница 46: ...no content intended for this page 36...
Страница 54: ...44...
Страница 60: ...50...
Страница 88: ...78...
Страница 94: ...84...


