6. If the [continuous] option was selected in step 5 above,
click on the [stop] option button, which has replaced
the original [continuous] option button, to terminate
data collection.
The
text display
window may be left open while other tasks
are performed, or it may be closed by clicking on the lower
[X] control button at the far right of the menu bar.
IMPORTANT
If you click on the upper [X] control button at the far right
of the PanaView title bar, you will exit PanaView completely.
2.3.2a Displaying multiple process parameters
The procedure for displaying a single process parameter in
a text screen may be repeated to simultaneously display
multiple process parameters. To do so, proceed as follows:
1. Display the first process parameter in a text screen, as
described in the previous section.
2. Repeat step 1 for any desired additional process
parameters, by double clicking on them in the PanaView
network tree. PanaView automatically tiles the multiple
text screens in the right pane of the
text display
window.
3. As in any standard windows application, the multiple
text screens may be resized by dragging their borders.
Also, the individual panes within a parameter’s text
screen may be resized by dragging the borders within
that text screen.
4. To close an open text screen, right click anywhere within
that screen (except in the title bar or the error section)
and click on the [Remove] option that pops up in the
context menu.
NOTE:
After resizing or removing any of the multiple text
screens, the default tiled layout may be restored by opening
the “
window
” menu (
see the
PanaView user’s manual
) and
clicking on the “
tile output displays
” option.
2.3.2b Displaying multiple text windows
The procedures for displaying one or more process
parameters in a single
text display
window may be
repeated to open multiple
text display
windows. To do so,
proceed as follows:
1. To open another
text display
window, repeat the steps
on
The text display output on page 24
.
2. To display the desired process parameter(s) in the new
window, repeat steps 1-4 in
3. Arrange the multiple
text display
windows as desired
via the
window
menu.
2.3.3 Graphing the output
To collect data from the instrument and display it
graphically in a new format, complete the following steps:
2.3.3a Setting up a graph
1. Perform steps 1-3 on
page 40
.
2. Pull down the
output
menu and click on the
graphing -
new
option (see
NOTE:
The
graph
window is stacked on top of any previously
opened windows (such as the
meter browser
window).
3. Using the
window
menu, arrange the open windows
in the desired format. For this discussion,
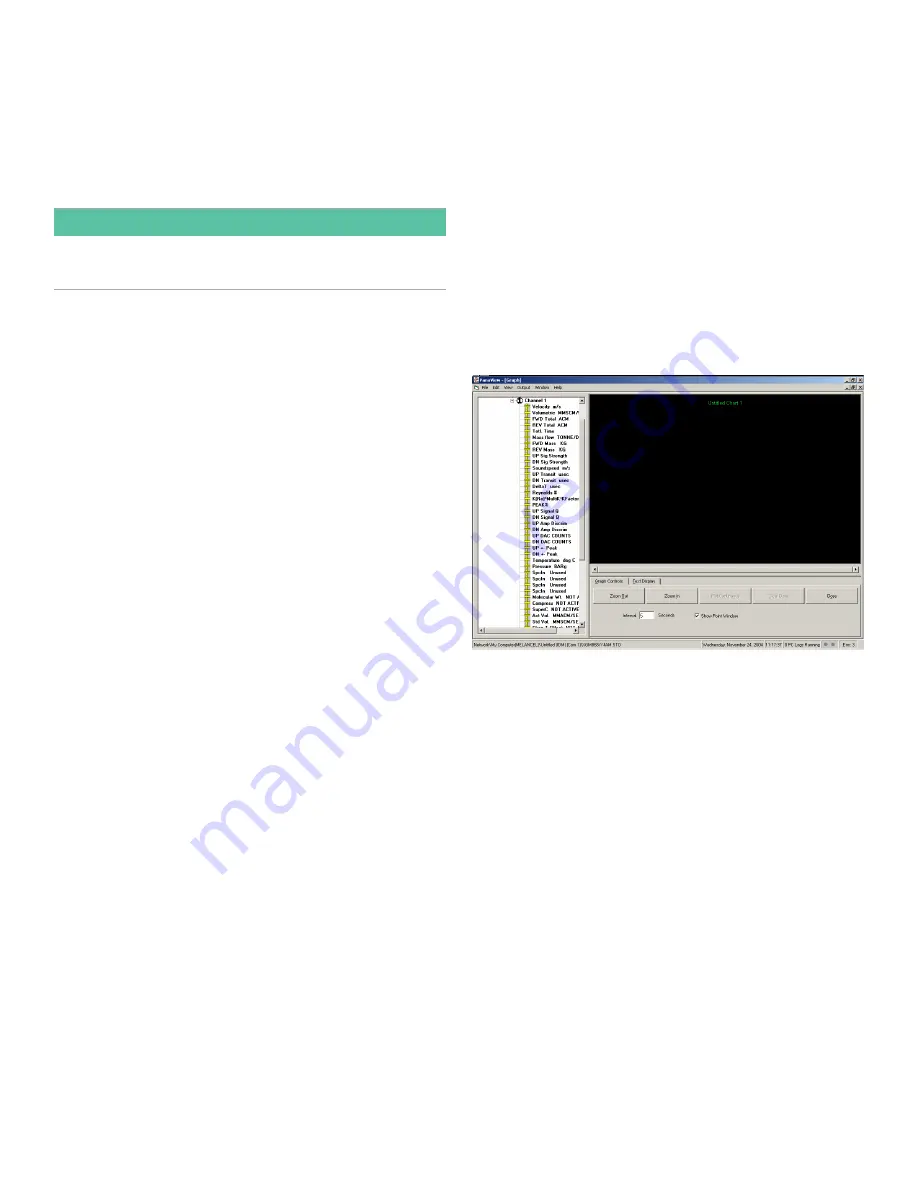
Figure 4
below shows the
graph
window in its maximized
(full-screen) size.
Figure 4: Graph window
The
graph
window shown above consists of three panes:
•
Left pane
- PanaView network tree
•
Top right pane
- graph with default chart style
•
Bottom right pane
- graph controls or text display
NOTE:
The three panes of the
graph
window may be resized
by simply dragging their borders.
25
Содержание DigitalFlow XGF868i
Страница 1: ...DigitalFlow XGF868i Panametrics flare gas flow transmitter Programming manual...
Страница 2: ...ii...
Страница 4: ...no content intended for this page iv...
Страница 10: ...x...
Страница 38: ...28...
Страница 46: ...no content intended for this page 36...
Страница 54: ...44...
Страница 60: ...50...
Страница 88: ...78...
Страница 94: ...84...


