Events and Performance Monitor
ARM DDI 0363E
Copyright © 2009 ARM Limited. All rights reserved.
6-6
ID013010
Non-Confidential, Unrestricted Access
6.2
About the PMU
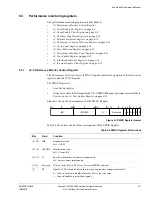
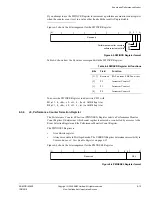
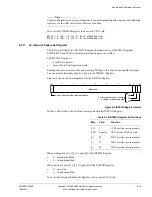
The PMU consists of three event counting registers, one cycle counting register and 12 CP15
registers, for controlling and interrogating the counters. The performance monitoring registers
are always accessible in Privileged mode. You can use the
User Enable
(USEREN) Register to
make all of the performance monitoring registers, except for the USEREN,
Interrupt Enable Set
(INTENS), and
Interrupt Enable Clear
(INTENC) Registers, accessible in User mode.
All three event counters are read and written through the same CP15 register. The
Performance
Counter Selection
(PMNXSEL) Register determines which counter is read or written. The three
Event Selection registers, one per counter, are read and written through one CP15 register in the
same way.
Using the control registers, you can enable or disable each of the event counters individually,
and read and reset the overflow flag for each counter. Any or all of the counters can be enabled
to assert an interrupt request output,
nPMUIRQ
, on overflow.
When the processor is in Debug halt state:
•
the PMU does not count events
•
events are not visible on the ETM interface
•
the
Cycle CouNT
(CCNT) register is halted.
For more information on Debug state see Chapter 11
Debug
.
The PMU only counts events when non-invasive debug is enabled, that is, when either
DBGEN
or
NIDEN
inputs are asserted. The
Cycle Count
(CCNT) Register is always enabled regardless
of whether non-invasive debug is enabled, unless the DP bit of the PMNC register is set. See
c9,
Performance Monitor Control Register
on page 6-7.

