1-40
IM 253710-01E
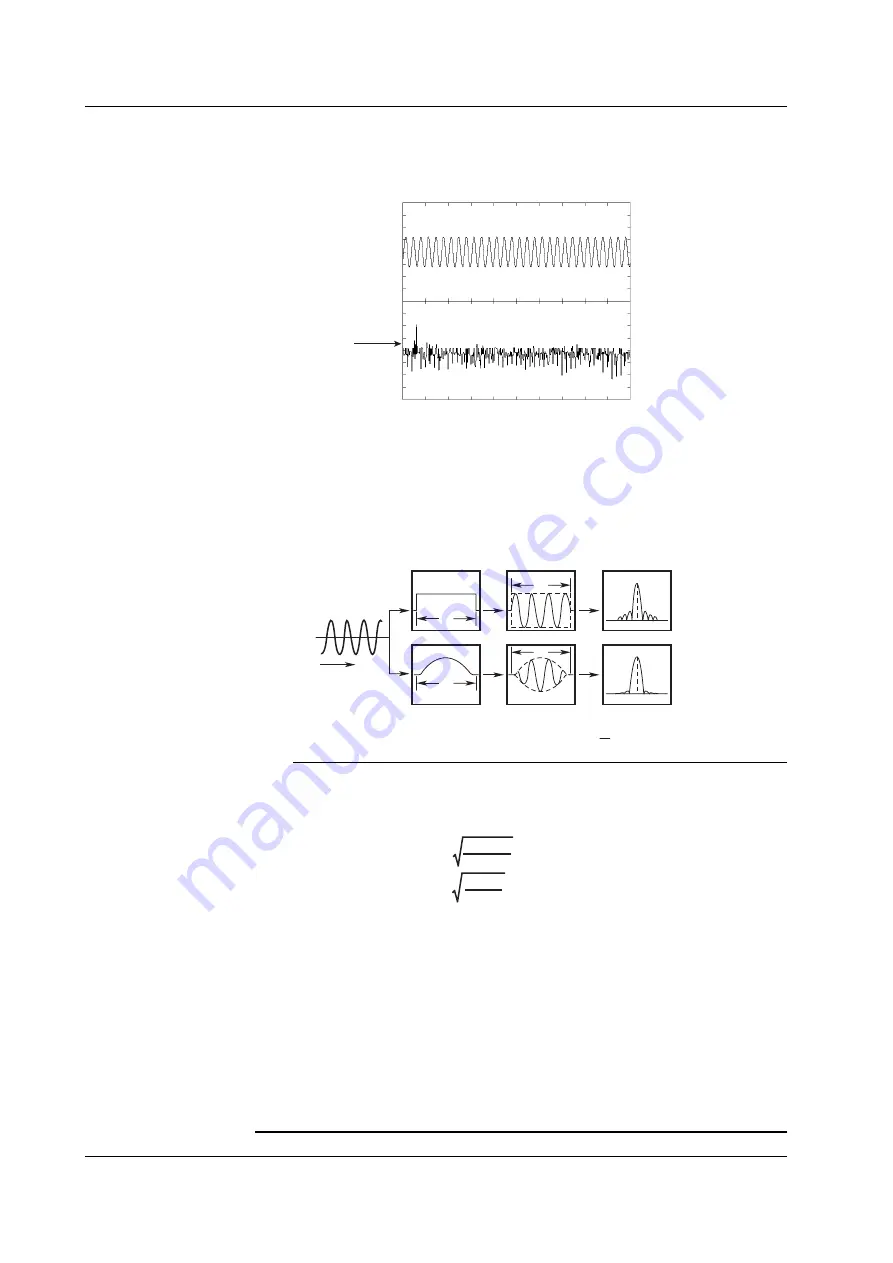
FFT «For procedures, see section 11.3.»
The power spectrum of the voltage, current, and active power can be displayed by taking
the FFT (Fast Fourier Transform). This function is useful for checking the frequency
distribution of the voltage, current, and active power.
Power spectrum
waveform
A rectangular window or Hanning window can be selected as the time window.
The rectangular window is best suited for transient signals such as impulse waves in
which the signal attenuates completely inside the window. The Hanning window gently
attenuates the signal near the ends of the window providing continuity in the signal. The
extreme ends of the window are set to zero level. The Hanning window is best suited for
continuous signals.
A FFT is performed on the sampled data of 1000, 2000, or 10000 points to give 500,
1000, or 5000 points of data, respectively, and the result is displayed.
T
T
T
T
t
Sine wave
Window
Product
Power Spectrum
Rectangular
Hanning
Rectangular window
Hanning window
: W(t) = u(t) – u(t – T) u(t) : Step function
: W(t) = 0.5 – 0.5 cos (2
π
)
t
T
Note
FFT
The power spectrum is expressed using the following equation.
Voltage power spectrum =
Current power spectrum =
Power spectrum of the active power =
U
r,
I
r
: Real Part U
j,
I
j
: Imaginaly Part
U
r
2
+ U
j
2
2
U
r
I
r
+ U
j
I
j
Take the complex function of the voltage after taking the FFT to be U = U
r
+ jU
j
, and
the complex function of the current to be I = I
r
+ jI
j
.
I
r
2
+ I
j
2
2
The difference between a harmonic measurement and a FFT on this instrument
In the harmonic measurement, the signal is sampled at a sampling rate that is in sync with the
PLL source. The signal components that are integer multiples of the fundamental signal are
measured. Therefore, the harmonic measurement is best suited to measuring signals that
contain a fundamental frequency component with its associated harmonics. It can be used to
determine the impedance for each harmonic order as well as the sum of all harmonic signals.
With the FFT, the signal is sampled at a fixed sampling rate determined by the observation time
and the memory size. The FFT contains frequency information up to half the bandwidth of the
sampling rate. Therefore, the FFT is best suited for analyzing signals that include components
other than integer multiples of the fundamental signal (distorted waves and noise). It can be
used to display the power spectrum with a frequency resolution of 500, 1000, or 5000 points.
1.8 Waveform Analysis


