


Activities
765
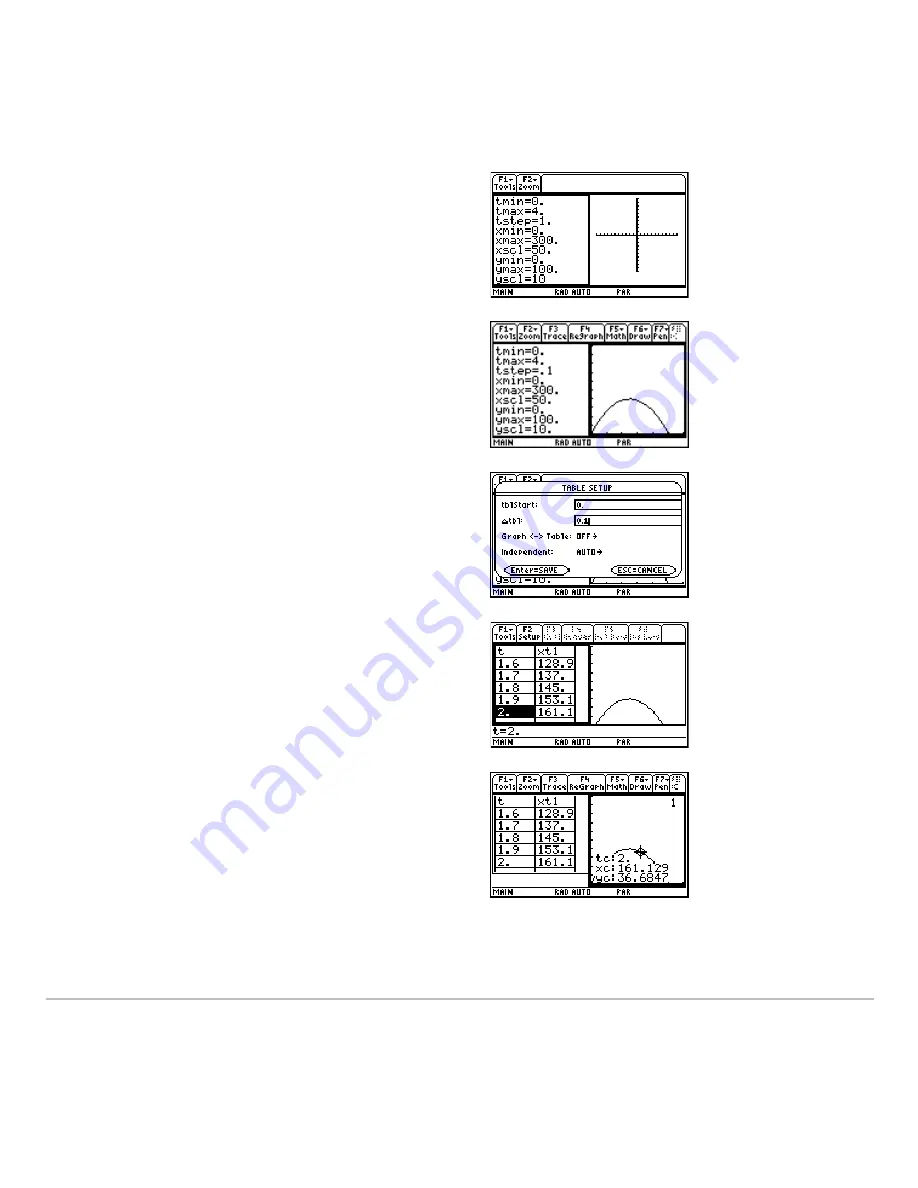
5. Set the Window variables to:
t values= [0,4,.1]
x values= [0,300,50]
y values= [0,100,10]
6. Switch to the right side and display the
graph.
Note:
Press
2 a
.
7. Display the
TABLE SETUP
dialog box, and
change
tblStart
to
0
and
@
tbl
to
0.1
.
Note:
Press
8 &
.
8. Display the table in the left side and press
D
to highlight
t=2
.
Note:
Press
8 '
.
9. Switch to the right side. Press
…
, and
trace the graph to show the values of
xc
and
yc
when
tc=2
.
Note:
As you move the trace cursor from
tc=0.0
to
tc=3.1
, you will see the position
of the ball at time
tc
.
Summary of Contents for TI-89 Voyage 200
Page 1: ...TI 89 Titanium Graphing Calculator...
Page 35: ...Getting Started 35 2 B u s i n e s s D B D B Press Result...
Page 44: ...Getting Started 44 3 0 D B D D Press Result...
Page 45: ...Getting Started 45 B D D 2 0 0 2 Press Result...
Page 46: ...Getting Started 46 D B Scroll down to October and press D 1 9 Press Result...
Page 60: ...Getting Started 60 Example Set split screen mode to TOP BOTTOM Press Result 3 B D...
Page 63: ...Getting Started 63 2 D B 4 Press Result...
Page 453: ...Differential Equation Graphing 453...
Page 468: ...Tables 468...
Page 539: ...Data Matrix Editor 539...


