


Basic Function Graphing
311
•
Use the
FnOn
and
FnOff
commands (available from the Home screen’s
†
Other
toolbar menu) for functions. Refer to the
Technical Reference
module.
•
Use the
PlotsOn
and
PlotsOff
commands for stat plots. Refer to the
Technical
Reference
module.
Setting the Display Style for a Function
Setting the Display Style for a Function
Setting the Display Style for a Function
Setting the Display Style for a Function
For each defined function, you can set a style that specifies how that function will be
graphed. This is useful when graphing multiple functions. For example, set one as a
solid line, another as a dotted line, etc.
Displaying or Changing a Function’s Style
Displaying or Changing a Function’s Style
Displaying or Changing a Function’s Style
Displaying or Changing a Function’s Style
From the Y= Editor:
1. Move the cursor to highlight the applicable function.
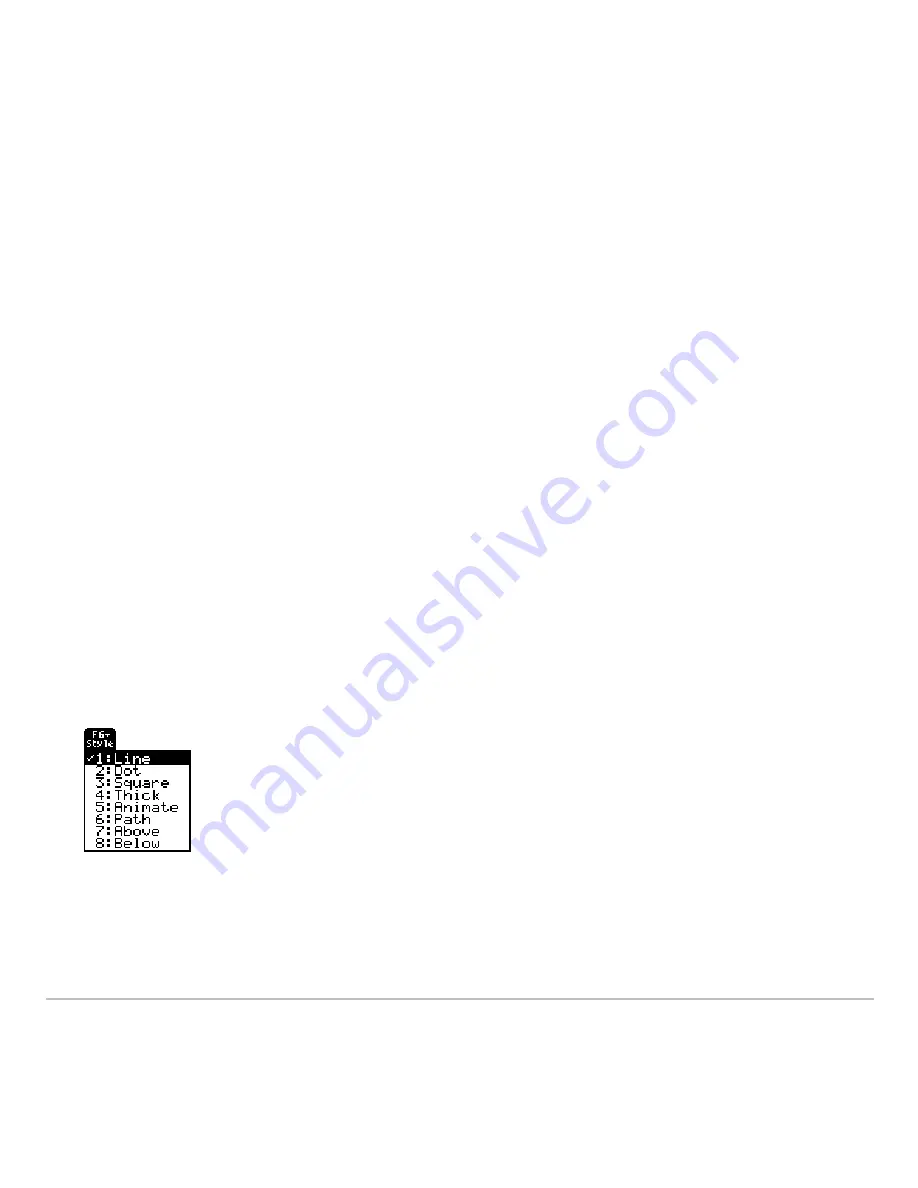
2. Select the
Style
menu and press:
2
ˆ
•
Although the Line item is initially
highlighted, the function’s current style is
indicated by a
Ÿ
mark.
•
To exit the menu without making a
change, press
N
.
Summary of Contents for TI-89 Voyage 200
Page 1: ...TI 89 Titanium Graphing Calculator...
Page 35: ...Getting Started 35 2 B u s i n e s s D B D B Press Result...
Page 44: ...Getting Started 44 3 0 D B D D Press Result...
Page 45: ...Getting Started 45 B D D 2 0 0 2 Press Result...
Page 46: ...Getting Started 46 D B Scroll down to October and press D 1 9 Press Result...
Page 60: ...Getting Started 60 Example Set split screen mode to TOP BOTTOM Press Result 3 B D...
Page 63: ...Getting Started 63 2 D B 4 Press Result...
Page 453: ...Differential Equation Graphing 453...
Page 468: ...Tables 468...
Page 539: ...Data Matrix Editor 539...


