


Statistics and Data Plots
559
Showing the List of Stat Plots
Showing the List of Stat Plots
Showing the List of Stat Plots
Showing the List of Stat Plots
Press
8 #
to display the Y= Editor. Initially, the nine stat plots are located “off the top”
of the screen, above the
y(x)
functions. However, the PLOTS indicator provides some
information.
To see the list of stat plots, use
C
to scroll
above the
y(x)
functions.
From the Y= Editor, you can perform most of
the same operations on a stat plot as you can
on any other
y(x)
function.
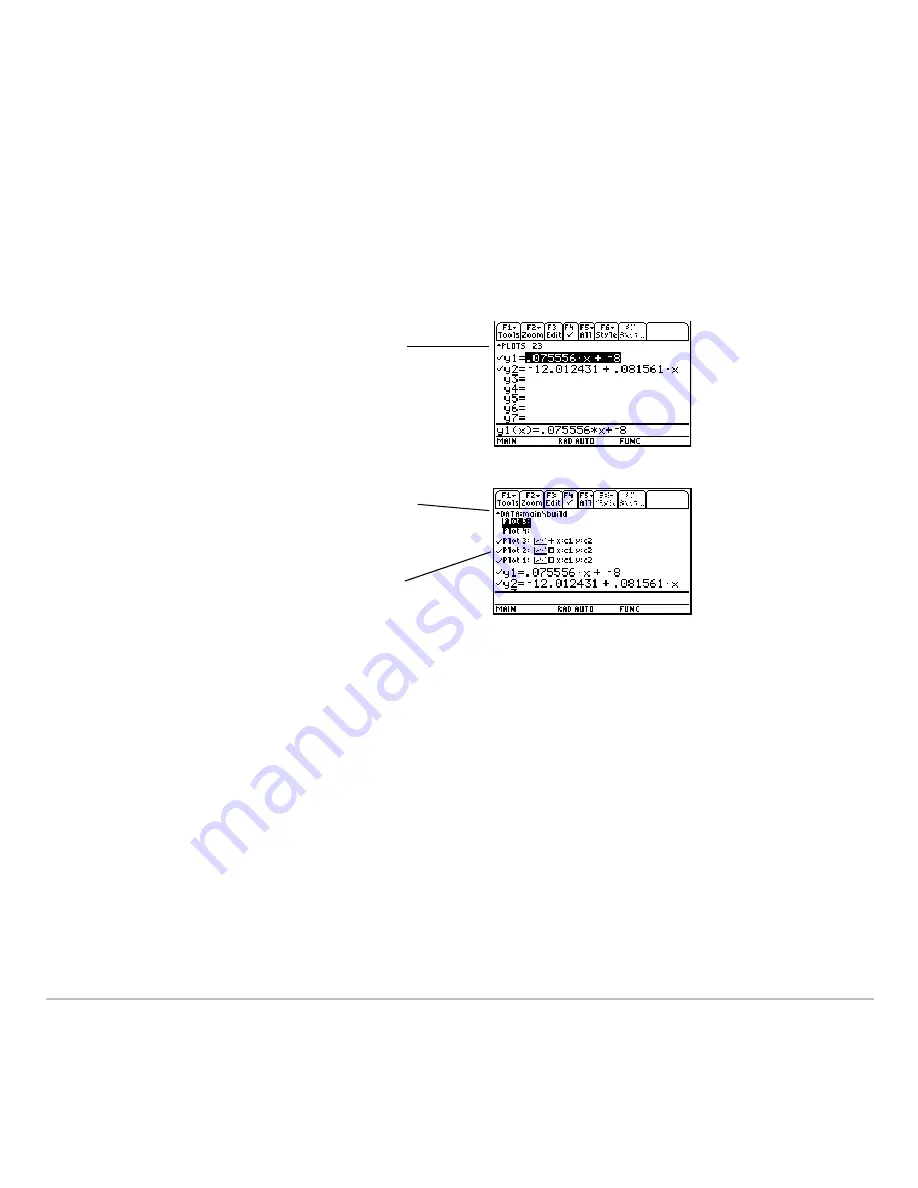
For example, PLOTS 23 means
that Plots 2 & 3 are selected.
If a Plot is highlighted, this shows
the data variable that will be used
for the plots.
If a Plot is defined, it shows the
same shorthand notation as the
Plot Setup screen.
Summary of Contents for TI-89 Voyage 200
Page 1: ...TI 89 Titanium Graphing Calculator...
Page 35: ...Getting Started 35 2 B u s i n e s s D B D B Press Result...
Page 44: ...Getting Started 44 3 0 D B D D Press Result...
Page 45: ...Getting Started 45 B D D 2 0 0 2 Press Result...
Page 46: ...Getting Started 46 D B Scroll down to October and press D 1 9 Press Result...
Page 60: ...Getting Started 60 Example Set split screen mode to TOP BOTTOM Press Result 3 B D...
Page 63: ...Getting Started 63 2 D B 4 Press Result...
Page 453: ...Differential Equation Graphing 453...
Page 468: ...Tables 468...
Page 539: ...Data Matrix Editor 539...


