


Basic Function Graphing
302
Basic Function Graphing
Basic Function Graphing
Basic Function Graphing
Basic Function Graphing
Overview of Steps in Graphing Functions
Overview of Steps in Graphing Functions
Overview of Steps in Graphing Functions
Overview of Steps in Graphing Functions
To graph one or more
y(x)
functions, use the general steps shown below. For a detailed
description of each step, refer to the following pages. You may not need to do all the
steps each time you graph a function.
Graphing Functions
Graphing Functions
Graphing Functions
Graphing Functions
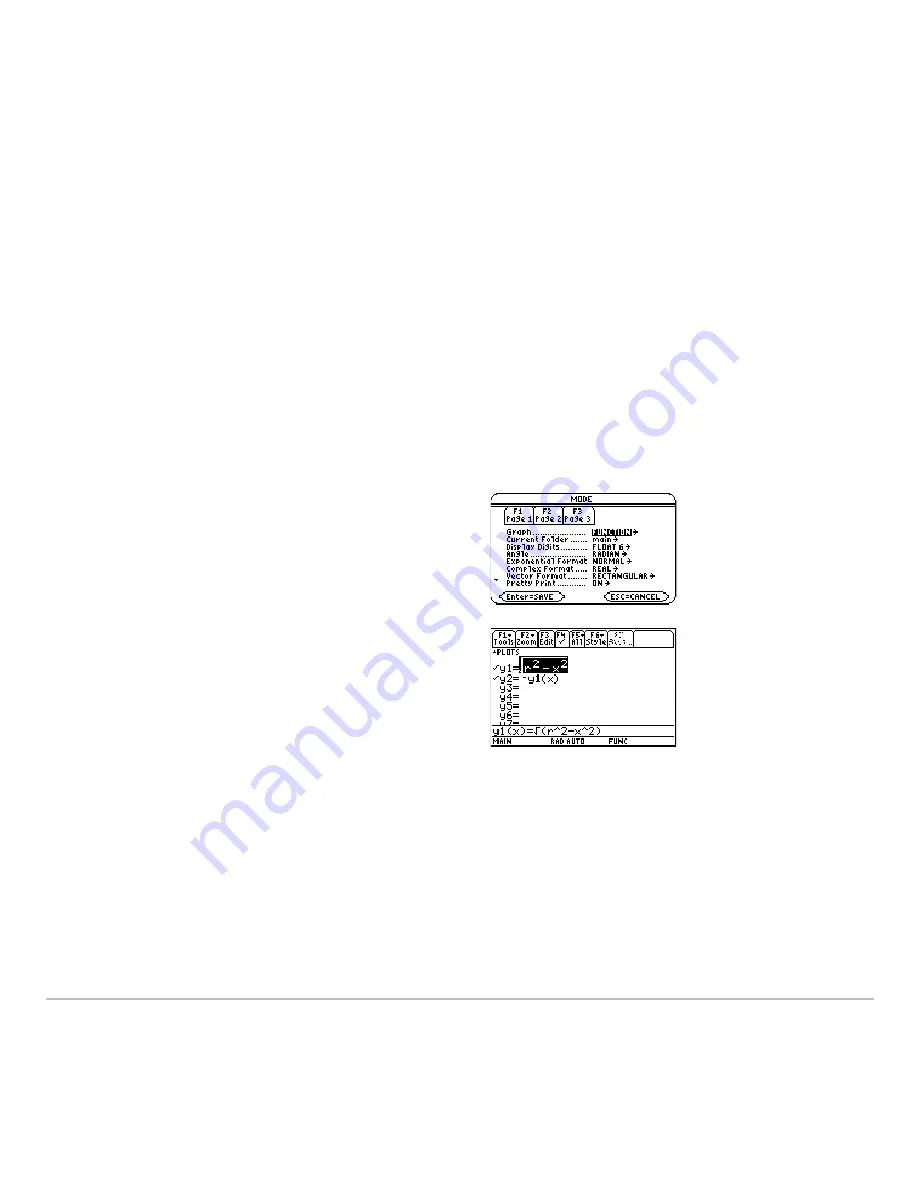
1. Set
Graph
mode (
3
) to
FUNCTION
.
Also set
Angle
mode, if necessary.
2. Define x and y components on Y= Editor
(
8 #
).
3. Select (
†
) which defined functions to
graph.
Note:
To turn off any stat data plots, press
‡
5
or use
†
to deselect them.
Summary of Contents for TI-89 Voyage 200
Page 1: ...TI 89 Titanium Graphing Calculator...
Page 35: ...Getting Started 35 2 B u s i n e s s D B D B Press Result...
Page 44: ...Getting Started 44 3 0 D B D D Press Result...
Page 45: ...Getting Started 45 B D D 2 0 0 2 Press Result...
Page 46: ...Getting Started 46 D B Scroll down to October and press D 1 9 Press Result...
Page 60: ...Getting Started 60 Example Set split screen mode to TOP BOTTOM Press Result 3 B D...
Page 63: ...Getting Started 63 2 D B 4 Press Result...
Page 453: ...Differential Equation Graphing 453...
Page 468: ...Tables 468...
Page 539: ...Data Matrix Editor 539...


