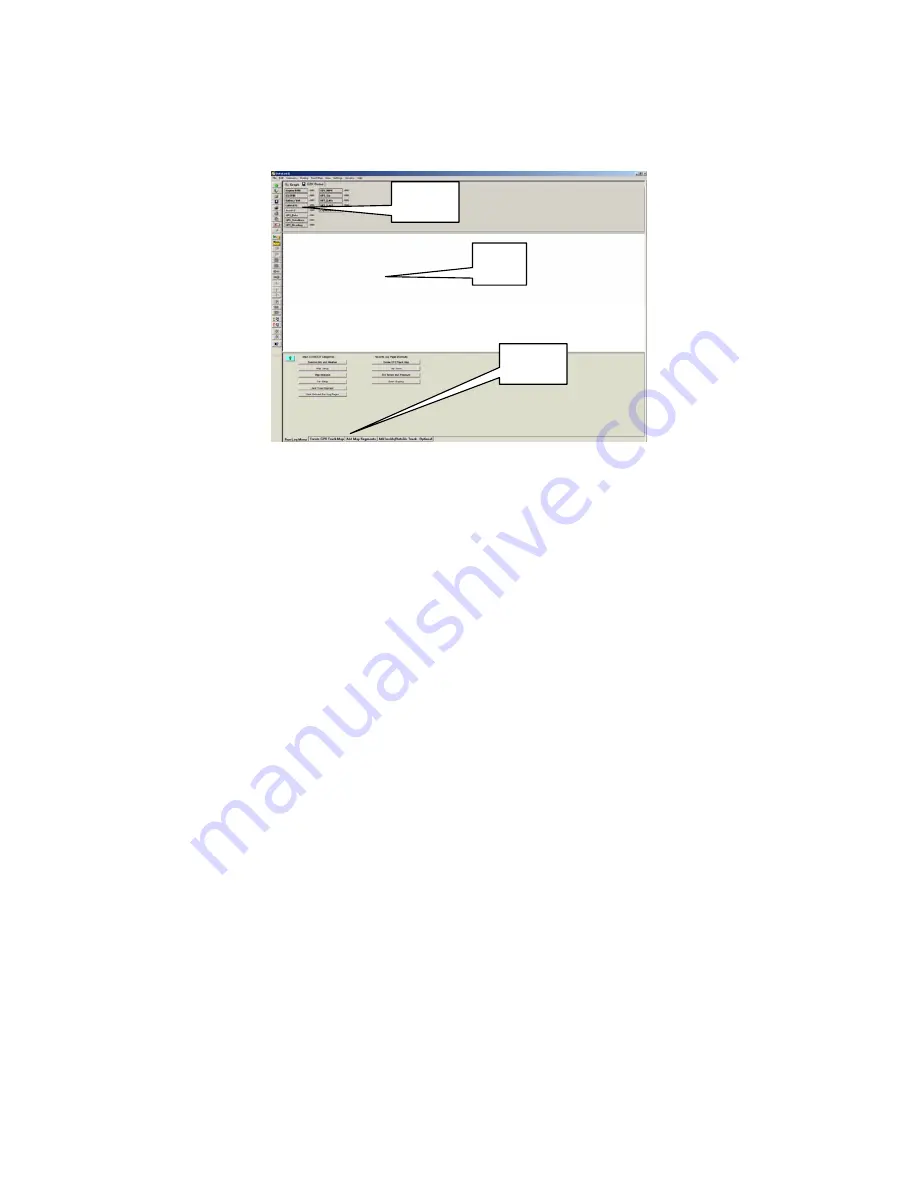
Adjusting the Screen Sections
Your PC screen should now display the following (less the callout boxes added for manual clarity):
Channel
Buttons
Graph
Area
Runlog
Pages
Upon opening of the above Runfile, it will be necessary to adjust the horizontal size of the Channel
Button, Graph and Runlog page area. To do so:
Place the mouse cursor on the border between any of the three areas. The mouse cursor will change to
up and down arrows.
Hold down the left mouse button and drag the horizontal line separating each area either up or down,
according to the need. The size of each area can be pre-set, according to the user’s preference. That
subject will be reviewed at a later time.
The screen is divided into three sections:
Channel Buttons:
A Channel Button is a visual representation of every data channel with valid data and provides real time
values for each data channel.
Main Graph:
As data channels are selected, the graph will appear in the main Graph
region, with the graph color corresponding to the Channel Button color box.
Runlog:
This section is a combination logbook, spreadsheet, database and graphical analysis area. Each tab at
the bottom of the screen represents a separate page.Runlog pages are factory designed analysis pages,
charts, graphs and screens that eliminate the “paper trail” commonly found in all forms of motorsports.
93


