ChartScan User’s Manual
ChartScan - Unit Startup and ChartView Tutorial 1-9
Once
ChartView
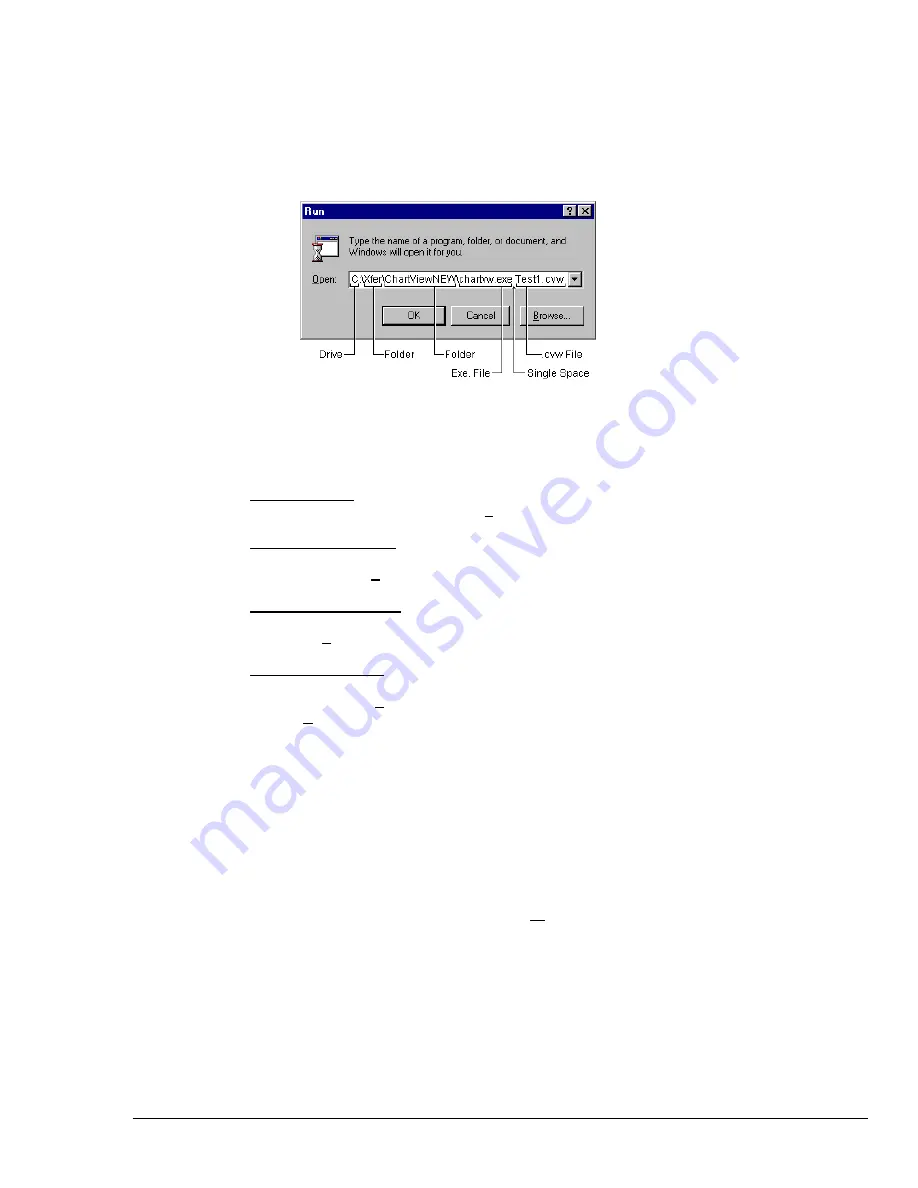
has a configuration file, you can start the program quickly using the Windows Run
dialog box. Before executing this command [by clicking on the OK box] specify a configuration file as
a command line parameter. In the following example, the user has specified a configuration file which
he had previously saved as
Test1.cvw
.
Note:
The file name can be manually entered, or can be accessed using the pull-down arrow and
scrolling the list of available file names.
Example of Using Windows’ Run Dialog Box to Open a File
After executing the command,
ChartView
’s Main Window opens. At this point review the following
configurable items prior to Data Acquisition. Make changes, or load a different configuration file if
desired.
;
;
;
;
Device Interface
Check the Interface and Status via the
Device
pull-down menu.
;
;
;
;
Channel Configuration
Check channel and alarm configuration settings via the
Channel Configuration Window
. Access this
window through the
Setup
pull-down menu.
;
;
;
;
Acquisition Parameters
Check the acquisition parameters via the
Acquisition Configuration window
. This window can be accessed
through the
Setup
pull-down menu.
;
;
;
;
Data File Parameters
Check Data File Parameters. These parameters can be set from the
Data Destination
window
(accessible from the
Setup
pull-down menu), and from the
Data File Parameters
selection accessible
from the
Data
pull-down menu.
Using the Run Dialog box to specify a configuration file is very efficient. By using this method and
various configuration files, you should find that managing systems with more than one acquisition
device is relatively simple. With the use of a portable PC, you can quickly interface with a specific
acquisition system.
The pull-down menus and numbered areas represented in the previous figure and table are detailed in
the Chapter 4,
ChartView and ChartView Plus.
To start the charts scrolling, push the “Start Charts and Indicators” button (item 2). More detailed
information pertaining to the charts and the
ChartView
Main Window appear in Chapter 4. In addition
to viewing the data as charts, you can select the
Windows
pull-down menu to select one or all of the
following:
•
ChartView
Analog Meters
•
ChartView
Digital Meters
•
ChartView
Bar Graph Meters
The meter-type data displays, along with the charts, can be on your computer screen at the same time.
They can be re-sized and repositioned as desired. Analog, Digital, and Bar Graph meters are detailed
in Chapter 4.
Summary of Contents for OMB-CHARTSCAN 1400
Page 1: ...August 2002 OMB CHARTSCAN 1400 Portable Data Recorder p n OMB 483 0901 Rev 3 1...
Page 6: ...iv ChartScan User s Manual...
Page 24: ...ChartScan User s Manual...
Page 32: ...2 8 General Information ChartScan User s Manual Notes...
Page 56: ...3 24 ChartScan User s Manual Notes...
Page 124: ...6 20 Calibration ChartScan User s Manual...
Page 126: ...A ii ChartScan User s Manual...
Page 136: ...API Commands Appendix A A 10 ChartScan User s Manual Notes...
Page 176: ...API Commands Appendix A A 50 ChartScan User s Manual...
Page 230: ...Appendix C Registers Data Formats Queries ChartScan User s Manual C 13...
Page 237: ...Registers Data Formats Queries Appendix C C 20 ChartScan User s Manual Notes...
Page 257: ...E 2 ChartScan User s Manual Notes...
Page 265: ...ASCII Code Summary Appendix F F 8 ChartScan User s Manual Notes...
Page 269: ...Abbreviations Appendix H H 2 ChartScan User s Manual Notes...
Page 271: ...ChartScan User s Manual...


