APPLIED OPERATIONS
/Image Analysis
2-201
Page
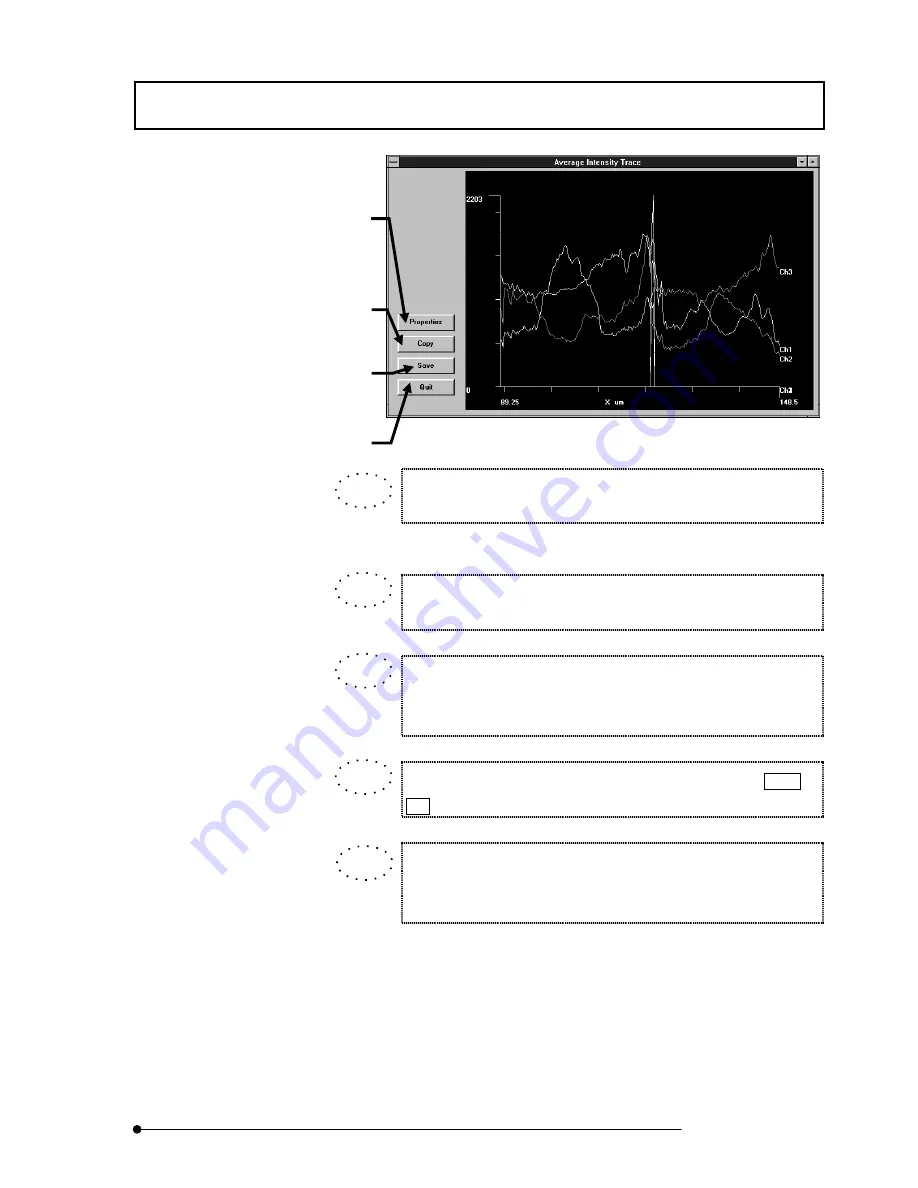
Fig. 2-95 [Average Intensity Trace] Window
When a desired area is specified by dragging the left button of the
mouse on the graph, the specified area can be magnified.
When the right button of the mouse is dragged on the graph, the graph
can be scrolled.
The magnification or scrolling of the graph can be canceled by
dragging the left button of the mouse from the bottom left to the right of
the magnified graph.
When the mouse pointer is placed on a graph line while the Ctrl or
Alt key is held depressed, the coordinates can be displayed.
The displayed data can be applied to other applications.
See section 2-10, “Transferring Data to Another Application” for
details.
<Save> button
Saves the profile data in a file using an
Excel-compatible format.
<Copy> button
Copies the plotted image in the
clipboard.
<Close> button
Quits the [Average Intensity Trace]
window and returns to the [Analyze]
panel.
<Properties> button
Displays the [Editing] dialog box for use
in detailed setting of the chart or change
of the chart display.
See section 2-14, “Changing the Chart
Display Method” for details.
TIP
TIP
TIP
TIP
TIP
Summary of Contents for FLUOVIEW FV500
Page 2: ......
Page 8: ......
Page 10: ......
Page 24: ......
Page 110: ......
Page 327: ...APPLIED OPERATIONS Viewing 3D Image 2 217 Page Fig 2 106 Panel Showing Stereo 3D Images ...
Page 396: ......
Page 402: ......
Page 414: ......
Page 420: ......
Page 426: ......
Page 428: ......
Page 430: ......
Page 458: ......
Page 460: ......
Page 462: ......
Page 468: ......
Page 469: ......


