A F
IRST
M
EASUREMENT
56
displayed.
Select an interesting region by drawing a square with the mouse pointer:
- Click on one corner of the region using the left mouse button, and keep
the button pressed.
- Drag the mouse to the other corner of the region, and then release it.
The size and the position of the square are shown in the Tool result panel.
- Release the mouse button when the square’s size covers approximately one
period of the grid.
- Confirm the selection by double clicking the color map graph using the
left mouse button. Now the selection is enlarged to the whole display size.
You can abort the zoom function by clicking
again.
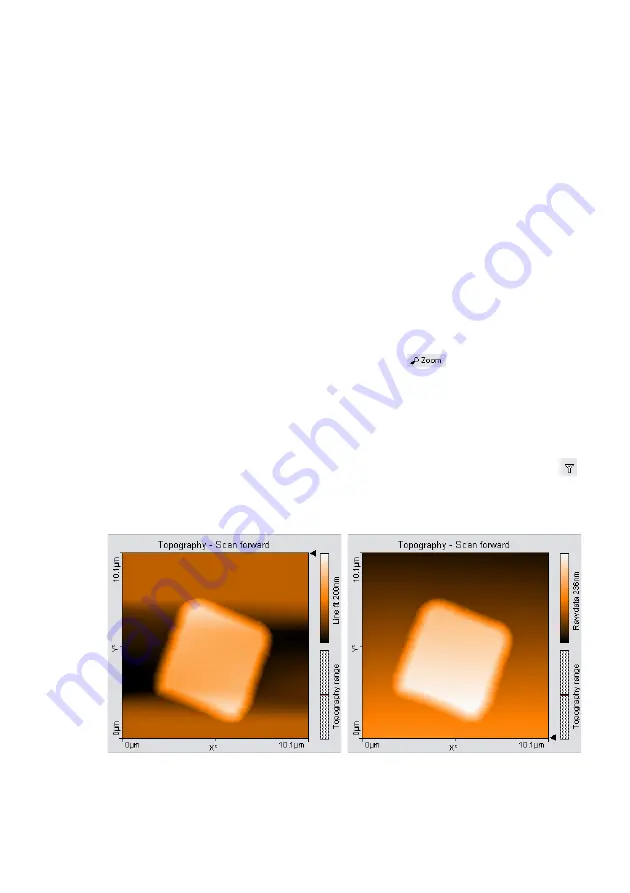
The microscope will now start measuring a single grid period. Once the
measurement is completed, you should get an image such as the one in
figure
. The depression in the sample surface to
the sides of the structure is due to data filter used. To remove it, select the
data filter ‘Raw Data’ in the Data filter drop-down, indicated by the
icon in the Chart bar. The chart will now become similar to figure
.
Zoomed measurement: left: with line subtraction, right: without line subtraction.
Summary of Contents for easyScan 2 AFM
Page 1: ...Operating Instructions easyScan 2 AFM Version 1 6...
Page 7: ...7...
Page 86: ...AFM THEORY 86 Scanner coordinate system x y...
Page 159: ...THE SCRIPT CONFIGURATION DIALOG 159 This page was intentionally left blank...
Page 160: ...AUTOMATING MEASUREMENT TASKS 160 This page was intentionally left blank...
Page 161: ...THE SCRIPT CONFIGURATION DIALOG 161 This page was intentionally left blank...
Page 163: ...163 Window Operating windows Imaging 120 Positioning 115 Report 153 Spectroscopy 128...
Page 164: ......


