V
IEWING
MEASUREMENT
DATA
138
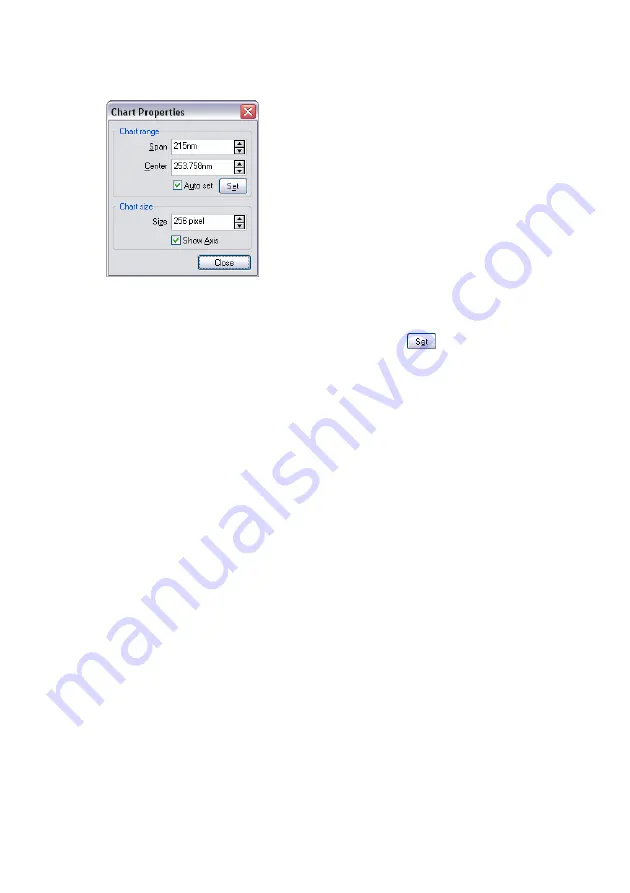
Auto set
When active, the chart scale is automatically set to optimally fit the meas-
urement data, as it is being acquired. Clicking
has the same effect as
clicking the Optimise Chart range button.
Chart size
Size
The size of the chart in pixels.
Show Axis
When active, the labels in charts and the color-bar in ‘Color map’ window,
are displayed.
Changing the appearance of the 3D view
Always click and hold the left mouse button on the 3D view chart while
changing the 3D view. The surface is reduced in feature complexity as long
as the left mouse button is pressed. Press the following additional keys/
buttons to determine what chart property is changed:
Surface rotation
mouse left/right
Surface tilt
mouse up/down.
Size displayed surface
‘Ctrl’- key + mouse up/down
Surface position
‘Shift’-key + mouse up/down/left/right
Z-scale magnification
left mouse right mouse mouse up/
down
Light source direction (360°)
‘Shift’+‘Ctrl’-key + mouse left/right
Summary of Contents for easyScan 2 AFM
Page 1: ...Operating Instructions easyScan 2 AFM Version 1 6...
Page 7: ...7...
Page 86: ...AFM THEORY 86 Scanner coordinate system x y...
Page 159: ...THE SCRIPT CONFIGURATION DIALOG 159 This page was intentionally left blank...
Page 160: ...AUTOMATING MEASUREMENT TASKS 160 This page was intentionally left blank...
Page 161: ...THE SCRIPT CONFIGURATION DIALOG 161 This page was intentionally left blank...
Page 163: ...163 Window Operating windows Imaging 120 Positioning 115 Report 153 Spectroscopy 128...
Page 164: ......


