Page 79
Operation
colorSENSOR CFO
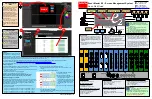
Since the representation on the monitor is only 2-dimensional, but the color space has 3 dimensions, it is represented in a third angle
projection, such as in the Lab color space from a to L; a to b; and L to b. The individual diagrams can also be displayed separately.
5.5.4.2
Timeline
Select the
Measurement > Timeline
menu
.
Now a measurement recording starts depending on the runtime when the diagram is activated/start. Via the time diagram, color
changes can be recorded over a longer period of time (up to 50,000 measurements).
i
If you need a longer recording, you can use the
sensorTOOL
.
6
1
2
3
4
5
7
Fig. 32 Measurement chart and timeline menu
Summary of Contents for colorSENSOR CFO
Page 7: ...Page 7 colorSENSOR CFO...
Page 8: ...Page 8 colorSENSOR CFO...
Page 96: ...Page 96 Operation colorSENSOR CFO Fig 45 Settings Color table menu...
Page 137: ......