User Manual for Vital Signs Monitor
23
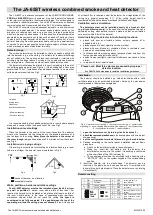
4.3 Trend Graph Display
Short pressing “
Display” key to shift the screen view to trend graph display screen, as shown in Figure
4.5.
Figure 4.5 Trend Graph
4.3.1 Screen Description
“12 hours”: the trend length of trend graph;
three options:
“
12”, “24” or “96” hours; when the
selection is 12 hours, the upper trend graph will display SpO
2
trend curve for last 12 hours.
“cursor on”:
enable the display of cursor on trend graph, i.e. the vertical cursor line displayed in trend
graph, so the user can move the cursor to inspect the SpO
2
value at the given time.
“SpO
2
”:
indicate that the trend graph beside it is SpO
2
trend. Let the cursor stay here and press“
■
”
key to confirm, then press “
▲
” key or “
▼
” key again to select trend graph type:
“SpO
2
”:
SpO
2
trend graph
“HR”:
HR trend graph
4.3.2 Operation Instructions
1. Press “
▲
” key or “
▼
” key to highlight “trend length” or “cursor on” selection.
2. Press “
■
” key to confirm.
3. Press “
▲
” key or “
▼
” key again to select value of trend length (12/24/96 hours) if the selecting box
stays in “trend length” option, or to move the cursor if the selecting box stays in “cursor on” option.
Instructions for viewing the trend curve:
y
Select “cursor on” and press “
■
” key to confirm, and “cursor on” becomes “cursor off” , then you
can press “
▲
” key or “
▼
” key to move the vertical cursor, the list box below will display
SpO
2
/HR value and the time value at the point where the cursor stays. Move cursor back and forth
this way, you can view the SpO
2
/HR trend (12/24/96 hours long). Press “
■
” key again to exit trend
viewing.
y
When pressing “
▲
” key or “
▼
” key to move cursor, the moving step is variable. The rule is that
the initial step is 1 point, after pressing “
▲
” or “
▼
” key towards the same direction for 5 times,
the step becomes 5 points, and with 5 more pressing the step becomes 10, then 20. No matter what
Trend length
Trend graph