3.
From here, you can further filter the events. Select from the following to
filter the events:
o
Filter Setting:
Administrators can set filters such as event type and
level of severity.
o
Device:
Select device information such as the IP address, vendor name
and device type from the drop-down list.
o
Time:
Set the time interval at which the event has occurred.
o
Event Source:
Select the source of the event saved in the database or
stored in a file.
4.
Save the settings and click
Query
to query the database and a list of
devices are displayed depending on the filter setting.
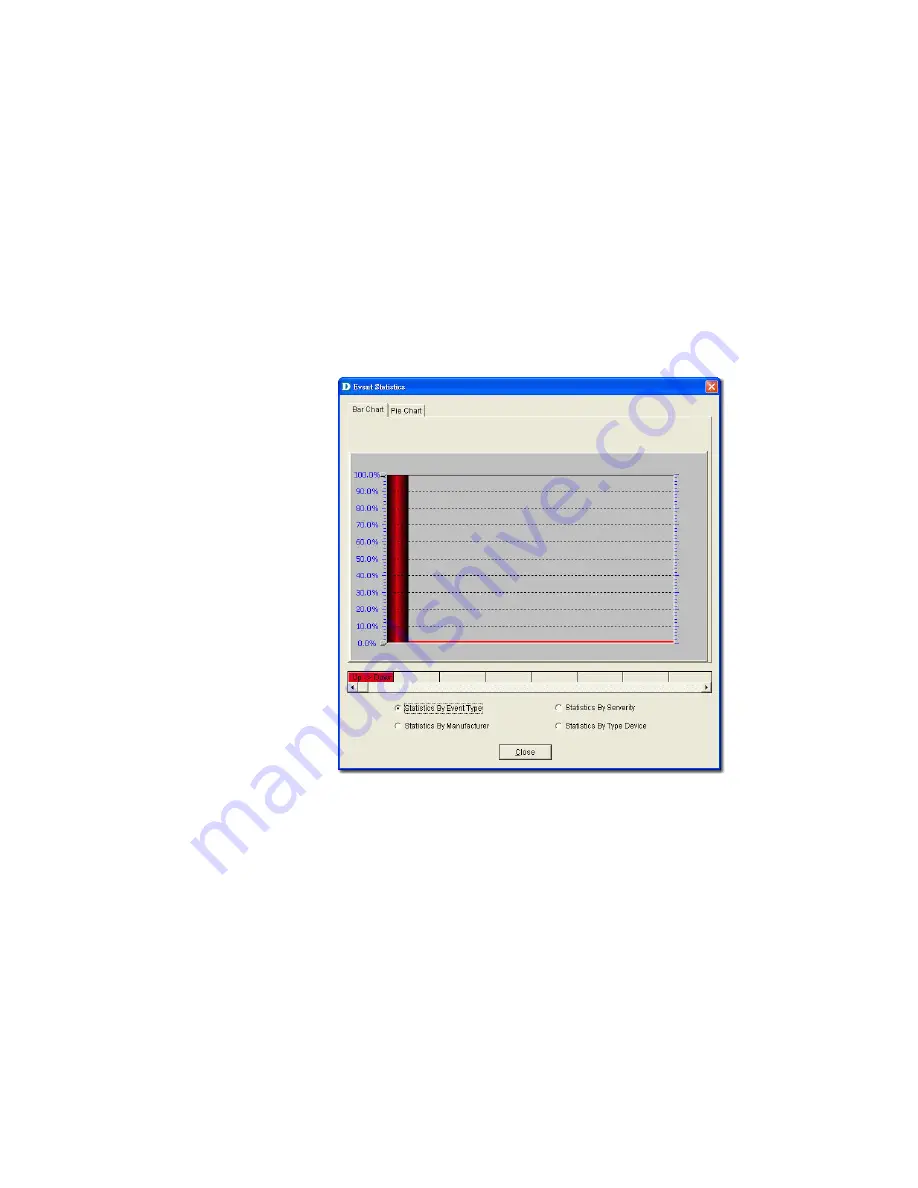
5.
Click
Statistic
to
view event statistics by event type, manufacturer,
severity and device type.
Figure 84:
Event Statistics: Bar Chart screen
Bar Chart:
Illustrates the event statistics by
Ev
o
ent
Type
,
Manufacturer
,
Severity
and
Device
Type
.
Summary of Contents for D-View 6 Professional
Page 1: ...NETWORK MANAGEMENT SYSTEM VER 1 00 Standard Professional User Manual ...
Page 8: ...Introducing D View 7 ...
Page 14: ...Installing D View 13 ...
Page 28: ...Understanding the Architecture 27 ...
Page 32: ...Understanding the Interface 31 ...
Page 41: ...Using D View ...
Page 48: ...Working with Topologies 47 ...
Page 62: ...Figure 51 Sequence of steps displaying the Topology Rollback function ...
Page 63: ...Managing and Monitoring Devices 62 ...
Page 103: ...Basic Operations 102 ...
Page 106: ......
Page 107: ...Figure 103 Sequence of steps navigating from the topology level to the domain ...
Page 124: ...Index ...
Page 126: ...Technical Support ...


