background image


17 

Running the MultiView Application 

To start the MultiView application: 
 
1)


From the Windows 

Start

 > 

Programs

 menu, choose 

WaferSense AMS

 > 

MultiView.exe

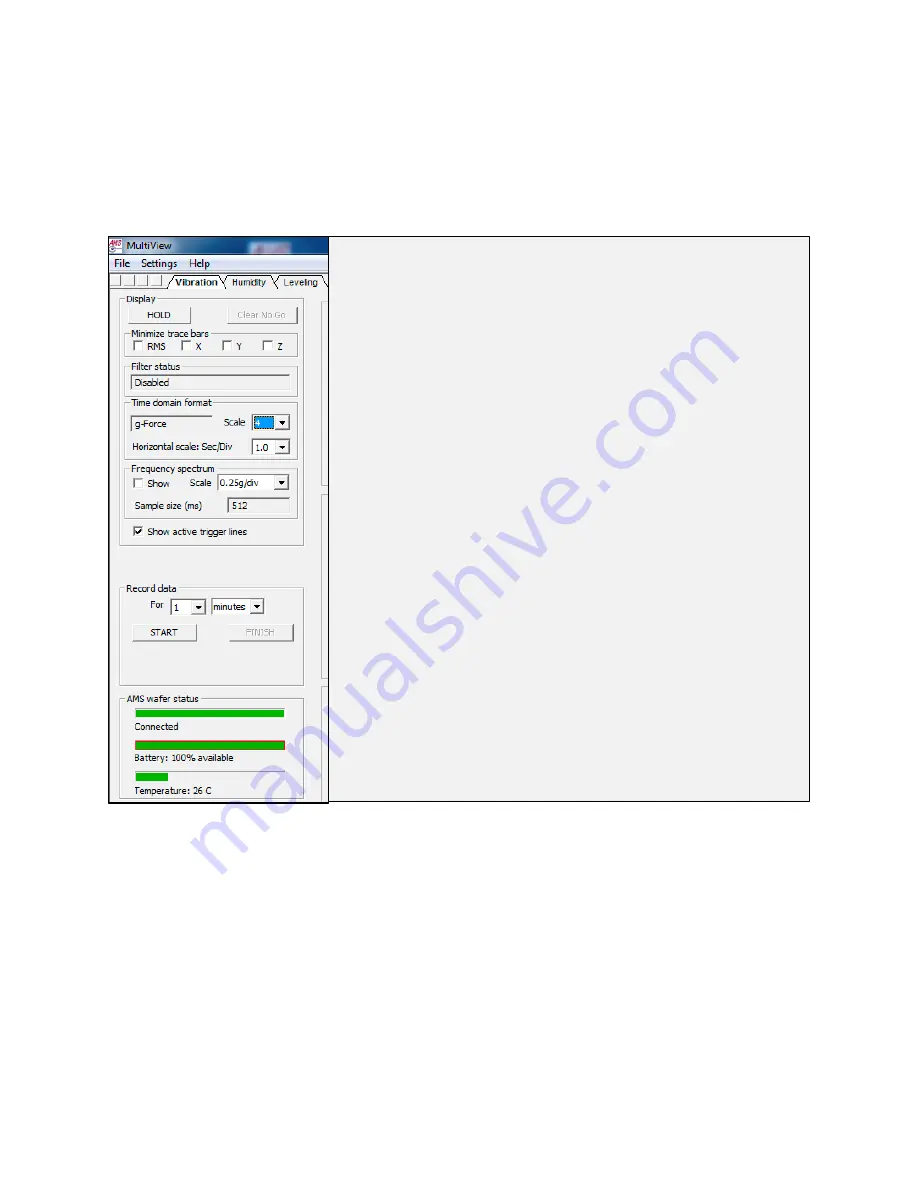
. The MultiView 

application starts, as shown in the figure below. Initializing communications usually takes less than a second. If 
the AMS has not been registered, MultiView will display the 

Calibration Registration

 dialog. To complete the 

registration, proceed to the next step. 


Graphing section of the screen 

Summary of Contents for AMS-150C

Page 1: ...8023533 Rev E CyberOptics WaferSense and ReticleSense AMS User s Guide For AMS 300C AMS 200C AMS 150C and AMSR wireless Auto Multi Sensors ...

Page 2: ...vice 16 Running the MultiView Application 17 Technical Support 19 Using Your AMS 21 Opening and Closing the Charging Case 22 Using the AMS Controls 23 Using the AMS Indicators 23 Using the Vibration Humidity and Leveling Tabs 24 Changing Colors in the Trace Screen 24 Printing the MultiView Window 26 Monitoring the Operating Temperature of the AMS 27 Using the Rechargeable Battery 28 Table of Conte...

Page 3: ...ding the Vibration Trace Display 42 Freezing the Trace Display 45 Monitoring Traces for Excessive Vibration Levels 46 Setting the Go No Go Tolerances 47 Setting Options for the No Go Indicators 48 Recording the Traces 49 Changing the Pre Recording Length 54 Placing Marks in a Log File 55 Including User Specified Information in the Log File 58 Understanding Log File Names 58 Importing Log Files int...

Page 4: ...ts 88 Compiling a Peak Acceleration Summary Report 88 Compiling a Peak Excursion Summary Report 90 Compiling a Time Domain Statistics Summary Report 92 Printing the MultiReview Window 93 Using the Humidity Function 94 How the Humidity Temperature Sensors Work 95 Factors to Consider When Making Humidity Measurements 98 Setting Go No Go Tolerances 99 Setting Triggers 100 Using Other Humidity Menus a...

Page 5: ...erance 121 Temporarily Changing the Vertical Tolerance and Target 122 Maintaining Your AMS 124 Annual Factory Calibration and Battery Replacement 125 Battery Use and Disposal 126 Specifications 127 Glossary 133 Appendices 135 Appendix A Moisture Conversion Table 136 Appendix B Psychrometric Chart 137 Appendix C Acoustic Resonances and other factors Affecting Acceleration Measurements 138 AHS Adden...

Page 6: ...h the instructions may cause harmful interference to radio communications However there is no guarantee that interference will not occur in a particular installation If this equipment does cause harmful interference to radio or television reception which can be determined by turning the equipment off and on the user is encouraged to try to correct the interference by one or more of the following m...

Page 7: ...death Refer to local regulations for handling and disposal of batteries Battery should only be serviced by CyberOptics Static Sensitive Components Observe precautions for static sensitive components Disposal The product must not be disposed of with normal waste Instead it is your responsibility to dispose of your waste equipment by arranging to return it to CyberOptics for recycling By separating ...

Page 8: ...ort cyberoptics com Phone 763 542 5000 800 366 9131 US and Canada only WaferSense and ReticleSense are registered trademarks and ParticleView and ParticleReview are trademarks of CyberOptics Corporation Third party brands and names are the property of their respective owners Copyright 2017 CyberOptics Corporation All rights reserved 5900 Golden Hills Drive Minneapolis Minnesota 55416 ...

Page 9: ...MultiView and MultiReview software The MultiView software application monitors the vibration humidity and leveling measurements and other status information in real time MultiReview lets you play back log files recorded in MultiView Both applications run on most personal computers that use the Microsoft Windows operating system See Specifications on page 127 for platform requirements Wireless link...

Page 10: ...10 The AMS controls and LED indicators are visible on the outside of the device as shown below Figure 1 Controls and LED Indicators LED indicators Reset switches are located on the edge of the unit ...

Page 11: ...f calibration While it is not as fragile as an actual silicon wafer handle the AMS with care as you would any precision instrument If the AMS is damaged or in need of calibration see the Maintaining Your AMS section Caution The AMS is thicker than a standard silicon wafer so use extreme care to assure that the wafer has proper clearances when being transported through the tool For example when you...

Page 12: ...AMS software do not plug in the link before you start The software must be installed first using the following steps 1 Log on using an account with Administrator privileges 2 Insert the AMS Installation Disk into the CD drive The Setup Wizard starts automatically as shown in the figure below If the wizard doesn t start automatically use Windows Explorer to view the contents of the CD and double cl...

Page 13: ...utton and the Setup Wizard starts installing the WaferSense AMS operating software on your computer A blue progress bar appears and when the installation is complete the following screen appears 6 Click OK The WaferSense AMS software is now installed This is important Do not run the AMS software at this time If you do you will compromise the overall AMS installation procedure and get an error mess...

Page 14: ...ave power cords Unpowered USB hubs won t work 3 The USB cable provided with your AMS system has a different plug on each end Locate the end with the plug that matches the USB port on your computer and plug the cable into the port 4 Plug the other end of the cable into the link module 5 Windows automatically finds the drivers installed during the Link Device Installer see the figures on the previou...

Page 15: ...nk module in your kit were paired at the factory and will operate with only that particular link module If either light is not on your AMS and link might not be paired with each other To reset the pairing see Changing the Pairing between the AMS and Link on page 31 4 Immediately after turning on the AMS the Connection Status lights on the AMS and link will blink slowly After a few seconds the AMS ...

Page 16: ...edule this service when it is convenient register your AMS with the factory When you start the MultiView application see Running the MultiView Application on page 17 it prompts you to register your AMS for calibration You can also register your AMS in any of the following ways On the Internet http cyberoptics com semiconductor_categories wsregistration html By sending an e mail message containing ...

Page 17: ...Sense AMS MultiView exe The MultiView application starts as shown in the figure below Initializing communications usually takes less than a second If the AMS has not been registered MultiView will display the Calibration Registration dialog To complete the registration proceed to the next step Graphing section of the screen ...

Page 18: ...18 2 If MultiView displays the AMS Calibration Registration dialog as shown in the figure below you haven t registered your AMS Follow the instructions in the dialog to complete the registration ...

Page 19: ...ps to reproduce the problem Information about your computer including manufacturer CPU type version of Windows and memory size The version of the MultiView application The software version is available in the MultiView application by choosing the Help About AMSView menu item If you are using MultiReview a similar dialog is available from the Help About MultiReview menu item The serial number of yo...

Page 20: ...20 Technical support Toll free 800 366 9131 US and Canada only E mail CSsupport cyberoptics com Internet www Cyberoptics com ...

Page 21: ...se Use the AMS controls Use the AMS indicators Use the Vibration Humidity and Leveling tabs Change colors in the trace screen Print the MultiView window Monitor the operating temperature of the AMS Use the rechargeable battery Monitor the wireless connection to the AMS device Change the pairing between the AMS device and link Using Your AMS ...

Page 22: ... tight After air transport it may be necessary to relieve the pressure differential in order to open the case To do so loosen the pressure relief vent screen until air enters the case Then re tighten the screw Opening the Charging Case To open the charging case 1 Loosen the captive screws on the top of the case 2 Lift the lid of the charging case using the captive screws Closing the Charging Case ...

Page 23: ...AMS Indicators The AMS has the following status LEDs see Controls and LED Indicators on page 10 Charger On Glows green when power is applied to the charging case Charging Glows red when the unit is being charged Goes dark when the battery has reached 100 charge Glows red if the charger is connected and the battery discharges below 95 Goes dark when the inductive charger is no longer powered Unit O...

Page 24: ...lay traces and other elements of the display The table below shows the display elements that you can change Display Element Description RMS RMS trace X X trace Y Y trace Z Z trace Indicator Vertical line at the right edge of the trace display where new data is first displayed Go No Go lines Horizontal lines showing current active Go No Go tolerances Trigger lines Horizontal lines showing current a...

Page 25: ...tom Colors The color palette expands as shown below Specify the color as a combination of hue saturation and luminosity or as a combination of red green and blue and click Add to Custom Colors 3 Click on the color you want to use for the display element and click OK 4 To reset all colors to the default values go to the Settings Select Colors menu and choose Restore Defaults to All 5 To reset only ...

Page 26: ... Print 2 In the Print dialog click OK 3 You can also select a printer other than the default and change the printer setup or see a preview of what MultiView will print To select a different printer change the paper selection or print orientation or set printer properties choose the File Print Setup menu item To see a preview of what MultiView will print choose the File Print Preview menu item ...

Page 27: ... 20 70 C 71 80 C 80 C The temperature bar changes color to indicate where the current temperature is relative to the accurate operating range using the following color coded bars Blue Less than 20 C The AMS is operating below the range where it produces accurate readings Green 20 70 C The AMS is operating in its optimum temperature range where it produces readings meeting the specified accuracy Or...

Page 28: ... the temperature range 15 45 C Monitoring the Battery Level MultiView receives frequent updates from the AMS on the status of the AMS s battery The Battery indicator in the AMS status area of the MultiView window shows the approximate percentage of operating time remaining before you must charge the battery Charging the Battery To charge the AMS device s battery 1 Use only the battery charger supp...

Page 29: ...rs the case Then re tighten the screw 5 When power is applied to the charging case the Charger on LED will light and the Charging LED will also light unless the unit is already fully charged In addition the Unit on LED will light If the unit is still paired to a powered link box the Connect Pair LED will light 6 Charge the unit until the Charging LED goes dark The unit is now fully charged and rea...

Page 30: ... is yellow the readings are still accurate but aren t being updated as frequently Red No connection Indicates that there is no connection between the AMS device and link module The values in the display do not update when the indicator is red The Bluetooth wireless link technology used in the AMS is a low power technology that operates in the 2 4 GHz radio frequency band This unlicensed band is al...

Page 31: ...urrently paired link module You can t pair an AMS with a new link module while the currently paired link module is powered on 2 Make sure the Power LED is illuminated on the link module you want to pair and make sure the Unit on LED is illuminated on the AMS 3 On the AMS press and hold the C reset switch until the Connect Pair LED starts to blink rapidly about four times per second 4 On the link m...

Page 32: ...the way the MultiView software operates The idea here is to introduce you to the underlying concepts behind each sub function so do not worry about the details The sub functions that are discussed are as follows Setting Go No Go Tolerances This allows you get an on screen warning when a measured parameter strays from its defined limits Setting Triggers This tells the AMS download current real time...

Page 33: ...xample In this example we are worried that one of the robots that feeds wafers into one of our tools is reaching the end of its service life Specifically the robot has logged over 10 000 hours of use and the bearings in its end effect that is responsible for horizontal back and forth movements the y axis is about to fail Setting Go No Go Tolerances To set Go No Go tolerances do the following 1 Ope...

Page 34: ...out to fail if the vibration exceeds 0 4g and that 0 20 is normal Hence we set 0 40 g for horizontal back and forth movements the y axis the key point here as these are the bearings we believe are about to fail in the end effector 6 In our example we ran the AMS through our system and observed the following traces in the Vibration screen The bearings are clearly about to fail y axis x axis Red col...

Page 35: ... MultiView will download a log file of the event for future reference Example In this example we have just installed a fancy new and very expensive dehumidifying system in our clean room because we need to minimize gallium arsenide oxidation on our wafers The new dehumidifying system is supposed to keep the relative humidity RH in our clean room in the range 6 2 We are now going to use the AMS to ...

Page 36: ...Set Triggers menu item MultiView populates the Set Triggers dialog with the default values 0 and 100 RH for the maximum possible number 5 of HT sensors on an AMS unit As our particular unit has only one HT sensor we are going to enter the upper rises above values and lower falls below values only for HT1 and ignore the default values for HT2 through HT5 Default values for HT1 ...

Page 37: ...ves a little leeway and to make sure the RH values actually fall outside the range 4 8 before data is downloaded to a log file As a result we have chosen 1 rises above and 1 falls below values of 3 90 and 8 10 respectively We ignored the other settings because they do not apply to our particular model of AMS 7 Click Apply to save the settings you entered 8 Click OK to close the dialog ...

Page 38: ... your wafer manufacturing process and 2 make filling in this dialog part of your everyday record keeping and quality control procedures If you need to refer to your log files in the future having this detailed information on file will make life much simpler Example See the humidity example on page 35 Setting Station Information To include user specified information in your log files do the followi...

Page 39: ...ion Information dialog open while using MultiView drag it off to the side so it doesn t cover the MultiView window Doing so makes it easy to change the Comment or other fields each time you start recording or as needed Be sure to click Apply after you finish making changes though or MultiView won t use the latest changes for the next log file You can change or delete this information at any time f...

Page 40: ... directory and file name and click Save MultiView saves your settings and the file you specified becomes the current settings file To save your settings in the current settings file 1 Choose the File Save Settings menu item 2 Each time you start MultiView the application automatically reads in the most recent settings from the Windows registry including the last settings file you specified if any ...

Page 41: ... tells you how to do the following Read the vibration trace display Freeze the trace display Monitor traces for excessive vibration levels Record the traces Chang the pre recording length Place marks in a log file Include user specified information in a log file Understand log file names Import log files into other applications Configure the trace display Using the Vibration Function ...

Page 42: ...ugh its paces and watch the MultiView display for levels of vibration that might indicate a problems with the equipment such as places where the AMS is making unwanted contact with a tool Appendix C describes acoustic resonances and other factors that affect vibration measurements To use the AMS Vibration system 1 Make sure the computer running the MultiView software is within the range of the lin...

Page 43: ...ions Looking down on the AMS with the logo at the top the X trace shows horizontal movement to left and right the Y trace shows horizontal movement to top and bottom and the Z trace shows vertical movement The AMS measures vibration in units of g force which is actually a measure of acceleration One g is the acceleration of gravity approximately 32 ft s2 9 81 m s2 with a range from 2 g to 2 g The ...

Page 44: ...an also change from displaying acceleration to displaying the signal energy g2 s For more information on displayed readings and scales see Changing the Time Domain Format on page 64 Grid Lines The vertical grid lines represent time intervals The default interval between grid lines is 0 5 seconds with 100 data points plotted in each interval To change the horizontal scale for the traces see Changin...

Page 45: ... display and disappear in as little as half a second depending on the display settings MultiView includes a Hold feature that lets you freeze the display though not the data stream 1 To freeze the trace display click Hold shown below The Hold button changes to Release and the traces stop moving but the AMS continues to send data to MultiView 2 To resume the trace display click Release The traces j...

Page 46: ...ation time from 1 to 10 milliseconds If the trace exceeds your settings but remains so for less than the qualification time the No Go tolerances are not affected and the bar remains green You can set the amount of time the red bar remains on from 1 to 10 seconds or it can stay on until you clear it with the Clear No Go button Extending the length of time the red bar remains on makes it easier to c...

Page 47: ...fied see Changing the Time Domain Format on page 64 4 For the No Go qualification time specify the length of time any trace must exceed any Go No Go tolerance before the No Go condition is triggered A trace that exceeds a tolerance for less than the qualification time will not trigger a No Go condition 5 Click Apply and the Go No Go tolerances take effect immediately When the next active No Go eve...

Page 48: ...nu item Settings Options The options dialog is displayed 2 If you want the indicator to remain red for a certain length of time following the event choose Keep No Go indicator on for and choose the number of seconds 3 If you want MultiView to alert you with an audible beep when a Go No Go condition is exceeded check Audio Beep on No Go 4 Click OK and the No Go options take effect immediately No Go...

Page 49: ...o events see sections below To record vibration data manually 1 In the Record Data menu use the For lists to set the length of time for the recording You can choose recording times of up to four hours Note that four hours of recording at 1 000 data points per second will fill about 150 MB of disk space 2 To start recording click Start The Start button changes to Pause MultiView will record for the...

Page 50: ...vel is exceeded see section below Go No Go The Go No Go feature is primarily for helping you view events in the data on the display see page 46 During a recording initiated by a Go No Go event subsequent events extend the recording time which is not true for triggers see section below Recording with Triggers Once recording has started any subsequent trigger events are ignored When recording stops ...

Page 51: ...specified value The units for trigger settings are the same as the units for the time domain format you have specified see above 5 Click Apply and the trigger settings take effect immediately 6 When the next active trigger event occurs MultiView starts recording data MultiView records for the specified length of time unless you click Finish or Pause see above The remaining time is shown below the ...

Page 52: ...second will fill about 150 MB of disk space The recording time is restarted every time a No Go event occurs So if you set the time for 30 seconds but a second No Go event occurs after recording has been in process for 20 seconds the total recording time will be 50 seconds 2 Choose the menu item Settings Set Go No Go The Set Go No Go dialog is displayed 3 Check the boxes to activate Go No Go for on...

Page 53: ...makes it easy to change the Go No Go tolerances If you want to close the menu click OK 8 Choose the menu item Settings Options The options dialog is displayed 9 Check the Record data on No Go box 10 Click OK 11 When the next active No Go event lasting longer than the qualification time occurs MultiView starts recording data MultiView records for the specified length of time unless you click Finish...

Page 54: ...a log file in MultiReview this length of pre recording data allows you to see a few seconds of data just prior to the event that started the recording You can adjust the length of this pre recording data from zero to five minutes To set the length of time for pre recording data 1 Choose the menu item Settings Options The options dialog is displayed 2 Under Pre recording length choose the interval ...

Page 55: ... on page 72 you can quickly jump to the location of any mark in the file Adding Marks Automatically for Pauses and for Recording Time Extensions In addition to the marks that MultiView places in the log file for the start of recording trigger events No Go events and when MultiView loses communication with the wafer you can have MultiView mark locations in the file where you pause recording and whe...

Page 56: ...ck the Add a mark when recording is extended box 4 Click OK Adding Marks Manually To manually add a mark to a log file 1 Choose the menu Settings Show Annotation Dialog This menu toggles the display of the Annotate Mark dialog on and off The setting is off by default 2 While you are recording data click Add a Mark ...

Page 57: ...e before you click OK in the Annotate Mark dialog You can t add another mark until you click OK If you don t want to be prompted with the Annotate Mark dialog when you click Add a Mark the next time the dialog appears check Don t show this dialog and click OK If you have previously checked this box and you now want to have the dialog displayed again choose the menu Settings Show Annotation Dialog ...

Page 58: ...5 21 15 47 39 amvdata Key yyyy year mm month dd day Key hh hour in 24 hour notation mm minutes ss seconds When you add marks to the log file see Placing Marks in a Log File on page 55 MultiView creates a second file with the same name as that of the log file but with the file extension amvmarks You can specify a different log file name prefix to replace the wafer serial number in which case MultiV...

Page 59: ...sion amvmarks You can specify a different log file name prefix to replace the AMS serial number in which case MultiView still adds the date time and the appropriate extension To specify a different log file prefix 1 Choose the menu item Settings Options The options dialog is displayed 2 In the Log file name prefix box enter the file name prefix you want to use for log files 3 Click OK ...

Page 60: ...At the top of the file MultiView writes a file header including the AMS serial number and the current settings for the filter and time domain format Each line of data consists of six entries RMS X Y Z Time and Marks with annotations if any You can choose to have the header information recorded at the end of the file instead of at the beginning see Importing Log Files into Other Applications on pag...

Page 61: ...ions The options dialog is displayed 2 Check the Record csv files too box 3 To have MultiView record the header information AMS serial number and the current settings for the filter and time domain format at the end of the file instead of at the beginning check the Record file header information at end of CSV log file box 4 Click OK ...

Page 62: ...tal scales by changing the colors of traces and other elements in the display and by showing or hiding the trigger settings and frequency spectrum Minimizing the Trace Bars You can minimize the bars for displaying the traces Minimizing the bar for a trace collapses the height of the bar for that trace The heights of the bars for the remaining traces expand to fill the area You can minimize the bar...

Page 63: ...oving very low frequency acceleration resulting from slow moves Removing high frequency noise The filter affects the display of the data but does not affect the data written to the amvdata log file However the filter does affect the data written to the optional csv file see Importing Log Files into Other Applications on page 60 To set up the filter 1 Choose the menu item Settings Set Filter The Se...

Page 64: ...so choose to display the absolute value of acceleration in Gals Using the absolute value can be helpful when comparing traces When displaying absolute value you will usually want to also use the high pass filter see Filtering the Data on page 63 Energy Displays the signal energy for the last specified number n of acceleration values Signal energy is calculated using the following formula 1 N n x2 ...

Page 65: ...ese settings To change the time domain format 1 Choose the menu item Settings Set Time Domain Format The Set Time Domain Format dialog is displayed 2 Click the down arrow and from the list choose the appropriate time domain format 3 If you want MultiView to display the absolute value of the acceleration values check the box for Absolute Value 4 Click OK ...

Page 66: ... 5 seconds between vertical grid lines and plots one point for every five readings received from the AMS You can change the horizontal scale to show from 0 1 seconds to 100 seconds between the grid lines At the 0 1 second setting MultiView displays every reading received from the AMVS that is one data point per millisecond When displaying at the higher scales MultiView can t display every reading ...

Page 67: ...the Horizontal Axis Time To change the horizontal axis time 1 Choose the menu item Settings Options The options dialog is displayed 2 For absolute time check the Use absolute time scale for time axis box 3 Click OK ...

Page 68: ...horizontal scale Using the Horizontal scale list choose the time interval you want between vertical grid lines and the new scale setting takes effect immediately Changing Colors For more information see Changing Colors in the Trace Screen on page 24 ...

Page 69: ...d the text at the top of the line identifies the frequency and the current amplitude for that frequency You can move the lines to monitor the amplitude at different frequencies By default MultiView performs the frequency analysis using a sample of 512 data points 512 milliseconds of data MultiView receives data from the AMS in packets of 100 data points The FFT is computed every 100 milliseconds u...

Page 70: ...green lines To move one of the vertical green lines right click in the frequency spectrum display To adjust the position of a line after using right click press the left or right arrow keys To line up all of the green lines double right click When you move the green line it moves between the frequency values determined by the FFT which in general are not integer values 4 To change the FFT sample s...

Page 71: ...might need to re enable these tolerances Showing and Hiding Trigger Settings You can add lines to the trace displays to show the active trigger settings see Recording with Triggers on page 50 To show active trigger lines on the display check the box for Show active trigger lines see figure below To hide all trigger lines on the display clear the box for Show active trigger lines ...

Page 72: ...ally MultiReview allows you to do the following Run MultiReview Use the playback controls Work with marks Monitor traces for excessive vibration levels Compare log files Change MultiView settings from MultiReview Change log files Analyze narrow peaks Save a subset of a log file Compile summary statistical reports Print the MultiReview window Viewing Log Files ...

Page 73: ...eview To view a log file do the following 1 In Windows press Start All Programs AMS MultiReview and the MultiReview screen is displayed 2 From the File menu choose Open Log File and the AMS Log Files dialog is displayed ...

Page 74: ...o and time domain format are all applied when you open a log file 4 To start the log file playing click the Play button The traces start scrolling from right to left and the Play button changes to Pause You can use the other Playback controls to jump ahead or back or to a particular place in the file play the file in reverse and adjust the playback speed These are described on the next page ...

Page 75: ...anges the button back to Play forward Play Reverse works similarly but plays backward toward the beginning of the file Back One Division Forward One Division Jumps forward or back one division One division refers to the time between the vertical grid lines which can be from 100 100 000 milliseconds depending on the horizontal scale setting see Configuring the Trace Display on page 62 Slider Draggi...

Page 76: ...he right of the counter is the total length of the file in milliseconds or data points To change the position in the file you can type a number into the counter text field and click Go Compared to the slider the counter gives you more precise control over positioning within the file You can also change the position in the file by using the arrows in the spin control A single click increments right...

Page 77: ... you might find it easier to move the traces by clicking and dragging When you click and drag the traces the counter changes accordingly To click and drag the traces 1 Move the cursor into the trace area and the cursor changes to a pointing hand 2 Click and hold the left mouse button 3 Drag the mouse to the left or right and release the mouse button When you release the button the trace display ju...

Page 78: ... an actual trigger or a No Go event Going to specific mark To go to a specific mark in a log file use the drop down list to choose a mark As soon as you click on a mark in the list MultiReview jumps to that position in the file Next and Previous buttons The Next and Previous buttons let you jump to the next or previous marks in the file At the last mark clicking Next takes you to the end of the fi...

Page 79: ...can add marks to a file whenever playback is paused MultiView automatically creates marks at the beginning and end of the file and for the trigger event You can t add user created marks where MultiView has created the Begin End and Trigger marks The Add button in MultiReview works just as the Add a Mark button does in MultiView For more information see Placing Marks in a Log File on page 55 Annota...

Page 80: ...and Delete buttons are active except for the Trigger Begin and End marks 2 To delete the mark click Delete To edit the annotation associated with the mark click Edit When you click Edit the Annotate Mark dialog appears 3 If you clicked Edit edit the text in the Annotate Mark dialog and click OK to save the change Monitoring Traces for Excessive Vibration Levels Monitoring your traces for excessive...

Page 81: ...ou can have it overlay all traces from the second file in the traces for the first file Overlaid traces appear in gray along with the colored traces from the first file To compare two log files 1 From the File menu choose Open Log File and the AMS Log Files dialog is displayed 2 Choose the first log file you want to compare and click Open MultiReview opens the log file and displays the traces at t...

Page 82: ...ttom of the window below the traces for the first file By default MultiReview displays all traces from the first file but only one trace at a time from the second file 6 To change which trace from the second file is displayed at the bottom of the window select a different trace from the Trace drop down menu see figure on the previous page ...

Page 83: ...iew Settings from MultiReview Based on what you see in reviewing a log file in MultiReview you might want to change some of the settings that you will use for a subsequent run in MultiView For example you might notice a specific event in the log file that you want to take a closer look at with another MultiView run MultiReview makes this easy to do by allowing you to open a MultiView settings file...

Page 84: ...ings dialog check the Modify boxes for any settings you want to save in the settings file 5 Modify any of the user defined information for Operator Tool Station and Comment Clear All lets you clear all of these fields 6 To save the settings for a future MultiView run click Save As In the AMS Settings File dialog edit the file as needed and click Save Note the file name so you can open it in MultiV...

Page 85: ...his function allows you to more easily analyze narrow peaks in your traces As such please see Configuring the Trace Display on page 62 for more information about configuring the trace display in MultiView MultiReview however offers one additional feature the ability to analyze narrow peaks in greater detail that is not available in MultiView Narrow peaks in the traces can be difficult to analyze b...

Page 86: ...t choose your time domain format from the drop down menu 3 If you want MultiReview to display the absolute value of the acceleration values check the box for Absolute Value 4 If you want MultiReview to hold and display peak values specify the hold time in the Hold Peak for box 5 Click OK 6 When you change the time domain format you might need to adjust Go No Go tolerances ...

Page 87: ... you to specify the start position of the subset of the log file that you want to save 2 Using the playback controls locate the starting point of the data subset you want to save aligning that point on the indicator line in the center of the trace display 3 In the Save Partial Data dialog click Next The Save Partial Data dialog now prompts you to specify the end position of the subset of the log f...

Page 88: ...iling a report MultiReview uses the same settings for all files The settings are determined by the following The settings for the most recent log file opened other than a comparison file The settings you make using the Settings menu items The default report format uses a vertical layout for each of the X Y and Z traces the table of amplitude data is listed first and the table of frequency data fol...

Page 89: ...s for the marks in the first file you open check the box Use run1 annotations for markings column If you want the marks identified generically Mark 1 Mark 2 Mark n and so on clear the check box 4 Click OK 5 Choose the menu item File Create CSV File Compile Summary Report Peak Acceleration and Frequency The AMS log files dialog is displayed 6 Select the files that you want to include in the report ...

Page 90: ...luated because of limits in the AMS electronics Only sustained signals are evaluated that is signals that last longer than the FFT sample size The report can summarize data from up to 50 log files Different log files can have different settings for filter and FFT sample size so when compiling a report MultiReview uses the same settings for all file The settings are determined by the following The ...

Page 91: ...91 To compile a peak excursion summary report 1 Choose the menu item Settings Options The options dialog is displayed 2 Follow steps 2 7 starting on page 89 ...

Page 92: ...s dialog is displayed see page 89 2 If you want the marks identified with the annotations for the marks in the first file you open check the box Use run1 annotations for markings column If you want the marks identified generically Mark 1 Mark 2 Mark n and so on clear the check box 3 In the Time domain summary report sample period box specify the sample period you want MultiReview to use in calcula...

Page 93: ... 2 In the Print dialog click OK You can also select a printer other than the default and change the printer setup or see a preview of what MultiReview will print To select a different printer change the paper selection or print orientation or set printer properties choose the File Print Setup menu item To see a preview of what MultiReview will print choose the File Print Preview menu item ...

Page 94: ... Function The humidity function allows you to measure both humidity and temperature at up to five locations depends which model you bought on the upper surface of the AMS as shown below Using the Humidity Function 1 2 3 5 4 ...

Page 95: ... 0 3 C accuracy air temperature sensor Absolute humidity measures the total amount of moisture in the air and is independent of the temperature Absolute humidity can be specified in a number of ways dew point ppm on a volume basis and ppm on a weight basis kg kg of dry air Appendix A see Appendix A Moisture Conversion Table on page 136 contains a table that gives corresponding values for these uni...

Page 96: ... used in close proximity to the HT sensors CAUTION Do not direct strong air blasts into the HT sensors CAUTION Store the AMS unit at a temperature of 10 50 C and in the range of 20 60 RH Short times up to four hours at RH levels outside of this range are acceptable If the AMS is stored at RH levels outside of this range for longer than four hours the AMS should be returned to an environment of 20 ...

Page 97: ...the RH reading to account for heating around the sensor One such case occurs in the AMS because the central HT1 humidity temperature sensor is in close proximity to the AMS electronics CyberOptics has taken great precautions to isolate the HT1 sensor as much as possible from its surroundings The heat path to HT1 has been constricted via slots in the PCB The air around HT1 is totally isolated from ...

Page 98: ...lectronics but the other four sensors HT2 through HT5 are on the cooler periphery of the wafer As a result the HT1 sensor usually returns a higher temperature reading than HT2 HT5 and the key point here also returns a lower RH reading than the other sensors as shown in the figure below The sections below tell you how to do the following Set Go No Go Tolerances for humidity Set Triggers for humidit...

Page 99: ... Go menu item MultiView populates the Set Go No Go dialog with the default values 12 00 and 8 00 3 Enter the appropriate values in the Rise above and Fall below data entry box If your AMS has additional HT sensors check the HT2 HT5 boxes if you want to set tolerances for these sensors 4 Click Apply to save your entries 5 Click OK to close the dialog ...

Page 100: ...page 26 Print Set Up see page 26 Exit select Exit to close the MultiView software Settings Menu Show Annotation Dialog see page 55 Set Go No Go tolerances see page 99 Set Triggers see page 35 Set Station Information see page 38 Select Colors see page 68 Options see page 48 Help Menu Display On Line Manual select to display the AMS manual Register WaferSense AMS see page 16 About Your AMS Wafer see...

Page 101: ...lows you to quickly and precisely adjust the robots and other components in your manufacturing process The leveling function allows you to make inclination measurements in the horizontal plane Using Your AMS This section tells you how to do the following Open the leveling function Use the AMS leveling wafer buttons and indicators Perform horizontal inclination measurements Perform vertical inclina...

Page 102: ...2 Opening the Leveling Function 1 Locate the Leveling tab in the top left corner of the MultiView opening screen 2 Click the Leveling tab and the following screen appears Wait while the system initializes ...

Page 103: ...t show inclination in two dimensions MultiView updates the readings several times per second so you see any changes in real time The left bubble display see figure below shows a representation the whole AMS wafer and the right shows a magnified view that allows you to make very precise leveling adjustments Figure 4 Whole Disk Bubble and Magnified Bubble Display Whole Disk Bubble Display Magnified ...

Page 104: ...MS as shown in the figure below Figure 5 Orienting the AMS When you move the leveling wafer the readings typically need some time to stabilize The bubble displays and numerical readouts are shaded during this stabilization period For ALS1 systems a message in the left bubble display counts down the seconds see the figure on the next page Whenever the leveling wafer detects movement MultiView resta...

Page 105: ...information on the accuracy of the readings see Specifications on page 127 The bubble level displays see the figure on the next page show the inclination graphically in real time In both displays the solid green circle represents inclination as a bubble in a bubble level would The blue circle indicates the Go No Go tolerance which you can adjust see Setting the Go No Go Tolerance on page 110 In th...

Page 106: ...u can choose between the Cartesian roll and pitch convention and the polar magnitude and direction convention Cartesian Roll and Pitch see figure below indicate the inclination angle in two dimensions Assuming you aligned the WaferSense AMS logo as described above see page 104 Roll indicates side to side tilt and Pitch indicates front to back tilt If the front edge is higher than the back or the r...

Page 107: ... horizontal or reference plane Direction is measured counter clockwise from the x axis and is always positive Magnitude is also always positive Display Units for Horizontal Inclination Horizontal inclination angles can be displayed in degrees or milliradians mradians or as rise over run Rise over run is the vertical height of a point on the edge of the wafer relative to the center of the wafer ris...

Page 108: ... you want the direction and magnitude of maximum inclination displayed choose Polar 3 For Inclination units choose either Angle or Rise over run and then select the units If the Rise over run choice isn t available MultiView isn t connected to a leveling wafer After you turn on the wafer and establish a connection you can make that selection 4 To save your settings click OK Note You can also set t...

Page 109: ... These default settings yield the most accurate measurements for all types of situations However when the position of the leveling wafer changes only a small amount between successive measurements you can adjust these settings so that you can work more quickly without sacrificing accuracy To specify the stabilization criteria 1 Choose the menu item Settings Set Stabilization Criteria The Set Stabi...

Page 110: ...o Go circle the bubble is green indicating that the reading is within your specified tolerance When the center of the bubble reaches or passes the edge of the Go No Go circle the bubble changes to red to indicate the reading exceeds your specified tolerance When the readings are beyond the specified accuracy range of the sensor the bubble is pinned against the edge of the display area and the colo...

Page 111: ...rence plane see the next page the maximum value is less than 3 8 degrees You can t set a tolerance that would extend the Go No Go circle beyond the edge of the left bubble display area If you try to set a value that is too large or too small MultiView prompts you to enter a value that is within the correct range You can also set the Horizontal display type and inclination units in this dialog For ...

Page 112: ...elative inclination by clicking the corresponding option button see the figure above Switching between Absolute and Relative to does not affect the current offsets for the reference plane inclination angles MultiView retains the last offsets until you change them When you specify a reference plane and set MultiView to display Relative to that plane the coordinate axes of the left bubble display sh...

Page 113: ...g the leveling wafer while rotating it can affect the accuracy of the calibration The procedure therefore instructs you to place marks on the surface at four points around the outside edge of the leveling wafer You can use these marks to rotate the leveling wafer without moving it off center relative to the first calibration reading To calibrate your AMS using MultiView Locate a surface large enou...

Page 114: ... field Cal values This dialog displays the current calibration values If you haven t calibrated the AMS since the last factory calibration both values are zero Clicking Reset to Factory Default changes the calibration values to the values set when the leveling wafer was last calibrated at the factory ...

Page 115: ...reference surface For 300mm or 200mm wafers with notch place a mark on the surface or on tape on the surface next to the edge of the AMS at the notch Place three additional marks on the surface next to the edge of the AMS at the scribe marks that are 90 degrees 180 degrees and 270 degrees from the notch or flat side Always mark all four positions ...

Page 116: ... displays the Step 3 of 4 Second Calibration Reading Dialog WAFERSEN Rotate the AMS 180 degrees and align the AMS with the four marks you made in the earlier steps as shown below Be sure to line up all four marks so that the rotated AMS is as close as possible to the same position it was in when you took the first calibration reading ...

Page 117: ... AMS to operate reliably a dialog displays telling you to contact customer support at CyberOptics If the new calibration offsets are within the allowed limits the wizard displays the Step 4 of 4 Finish Calibration dialog as shown above Click Save to save the new calibration values That completes the zero point calibration ...

Page 118: ...following tasks with MultiReview Running MultiReview Choosing display units and conventions Temporarily changing the Go No Go tolerance Temporarily changing the vertical tolerance and target Changing log files Displaying station and wafer information Printing the MultiReview window This section assumes that you are familiar with the information in Using Your AMS starting on page 21 ...

Page 119: ...e Leveling tab 3 From the File menu choose Open Log File The AMS Log File dialog is displayed 4 Choose a log file and click Open MultiReview opens the log file and displays the data for the first entry in the file see figure below 5 To view the data for a different entry in the log file use the Next and Previous buttons or choose an entry from the Select entry list ...

Page 120: ...nformation see Choosing Display Units and Conventions on page 106 Setting Display Units and Conventions To set the units and convention used to display horizontal inclination 1 Choose the menu item Settings Set Display Units on the ALS2 Vertical choose Set Horizontal Units The Set Display Units or Set Horizontal Units dialog is displayed as shown below 2 For Display type if you want pitch and roll...

Page 121: ...t Go No Go Tolerance The Set Go No Go Tolerance dialog is displayed as shown below 2 Specify the New Go No Go tolerance and click OK You can set the tolerance to any value in the range 0 05 to 3 8 degrees However if you are using a reference plane see Specifying a Reference Plane on page 112 the maximum value is less than 3 8 degrees You can t set a tolerance that would extend the Go No Go circle ...

Page 122: ...ewing However as soon as you select a new entry from the log file the vertical tolerance and target displayed revert to that of the log file entry To change the target and tolerance settings 1 Choose the menu item Settings Set Vertical Tolerance 2 The Set Vertical Tolerance dialog is displayed as shown below The currently set values for both Tolerance and Target are shown 3 Enter the New vertical ...

Page 123: ...ing Other MultiReview Functions Here s how to access other MultiReview Functions Changing Log Files See page 60 Displaying Station and Wafer Information See page 38 Printing the MultiReview Window See page 26 ...

Page 124: ...ed by compliance EN61010 1 2010 may be impaired if the equipment is not used as specified CAUTION Use extreme care to assure that the AMS has proper clearances when being transported through the tool For example when you use the AMS in the tool for the first time move the device through the tool in manual mode visually verifying all clearances Even when clearances are sufficient for safe AMS pass ...

Page 125: ...er procedures for this environment WARNING Do not immerse the AMS or the link module in liquid Do not spill liquid on the AMS or on the link module Do not apply IPA near any of the humidity HT sensors WARNING The use of controls adjustments or procedures other than those specified in this manual may result in exposure to hazardous optical radiation Annual Factory Calibration and Battery Replacemen...

Page 126: ...se dispose of AMS and the lithium ion battery it contains in a responsible manner WARNING Your AMS contains a lithium polymer battery To avoid damage to the AMS only use the supplied charger Do not charge the AMS at temperatures outside the specified range 0 45 C Do not incinerate or dispose of the AMS into fire Do not immerse the AMS when cleaning or spill liquids on the AMS For proper battery di...

Page 127: ...nd steppers Weight 340 grams 15g Operating Pressure 0 1 6 atmosphere 0 1 6 atmosphere Operating internal temperature 15 60ºC non condensing up to 82ºC for short periods 15 60ºC non condensing up to 82ºC for short periods Storage temperature 15 60ºC non condensing 15 60ºC non condensing Charging temperature range 0 45ºC 0 45ºC Link Box Blue tooth Class 1 2 4GHz connected via USB Blue tooth Class 1 ...

Page 128: ... for maximum accuracy see page 113 Leveling resolution 0 002 degrees 0 002 degrees Vibration range Range 2 G Range 2 G Vibration resolution 0 01G 0 01G Vibration frequency response 0 200Hz 3dB point 0 200Hz 3dB point Humidity and temperature range and accuracy RH Range 2 5 85 RH RH Accuracy 2 RH at 20ºC T Range 15 60ºC T Accuracy 0 3ºC RH Range 2 5 85 RH RH Accuracy 2 RH at 20ºC T Range 15 60ºC T ...

Page 129: ...129 Dimensional Drawings Here are the dimensional drawings for the AMS AMS 150C Dimensions millimeters ...

Page 130: ...130 AMS 200mm Dimensions millimeters ...

Page 131: ...131 AMS 300C Dimensions millimeters ...

Page 132: ...132 AMSR Dimensions millimeters ...

Page 133: ...cle sensor reticle quartz ATM Atmospheres CD Compact disk CPU Central processing unit CSV Comma separated values FCC Federal Communications Commission FFT Fast Fourier transform HT Humidity temperature sensor on the upper surface of the AMS IC Integrated circuit ID Identity IPA Isopropyl alcohol ISM Institute for Supply Management LED Light emitting diode MB Megabytes Glossary ...

Page 134: ...134 Acronym Description MEMS Micro electro mechanical system PCB Printed circuit board PPM Parts per million RF Radio frequency RMS Root mean square RH Relative humidity USB Universal serial bus ...

Page 135: ...ontain additional information about humidity measurements as follows Appendix A Moisture Conversion Table Appendix B Psychrometric Chart Appendix C Acoustic Resonances and other factors Affecting Acceleration Measurements Appendices ...

Page 136: ... 17 52 70 14 4 16402 10180 16 35 65 13 2 15212 9442 15 18 60 12 14026 8705 14 02 55 10 7 12842 7971 12 85 50 9 3 11661 7238 11 68 45 7 7 10483 6506 10 51 40 6 9307 5777 9 34 35 4 1 8134 5049 8 17 30 1 9 6964 4322 7 01 25 0 5 5797 3598 5 84 20 3 2 4632 2875 4 67 15 6 6 3470 2154 3 5 10 11 2 2311 1434 2 34 9 12 4 2079 1290 2 1 8 13 6 1848 1147 1 87 7 15 1 1616 1003 1 63 6 16 8 1385 860 1 4 5 18 7 11...

Page 137: ...137 Appendix B Psychrometric Chart ...

Page 138: ...ch as AVS and AMS also have these modes as well as other smaller resonances caused by the housing structures The resonance frequency is primarily determined by the thickness area and material density So an AMS unit will have different resonances from an AVS unit which will have different resonances from a silicon wafer The method of clamping whether uniformly clamped at the edge clamped in a few p...

Page 139: ...e z direction An AMS unit compared to another AMS unit will have traces almost identical to each other Figure 2 below shows a 200mm AMS unit top compared to a 300mm AMS unit bottom Figure 2 Response of 200mm AMS unit top and 300mm AMS unit bottom clamped together and simultaneously shaken in the z direction ...

Page 140: ...ial foam or rubber sandwiched between the AVS or AMS housing and another stiff high density material will attenuate resonances The alternating layers of high and low density materials damp the resonances Therefore when AMS and AVS units are compared against each other there will be some unavoidable differences caused by the resonances and different housing construction Resonances cause the largest...

Page 141: ... an AHS wafer the main screen will hide the tab control and display the humidity view see Figure A 1 The tab control is used to switch between the vibration humidity and leveling views Since vibration and leveling are not available on AHS wafers the tab control is unnecessary Main Screen The MultiView main screen in AHS mode looks and functions like the humidity view tab in AMS mode This view is d...

Page 142: ...device are opened in MultiReview the application will configure the main screen similarly to MultiView with the tab control hidden and the humidity tab as the main view see Figure A 2 The MultiReview main screen in AHS mode looks and functions like the MultiReview humidity view tab in AMS mode This view is described in the AMS manual ...

Page 143: ...143 Figure A 2 AHS Mode MultiReview Main Screen ...

Reviews: