-
80
-
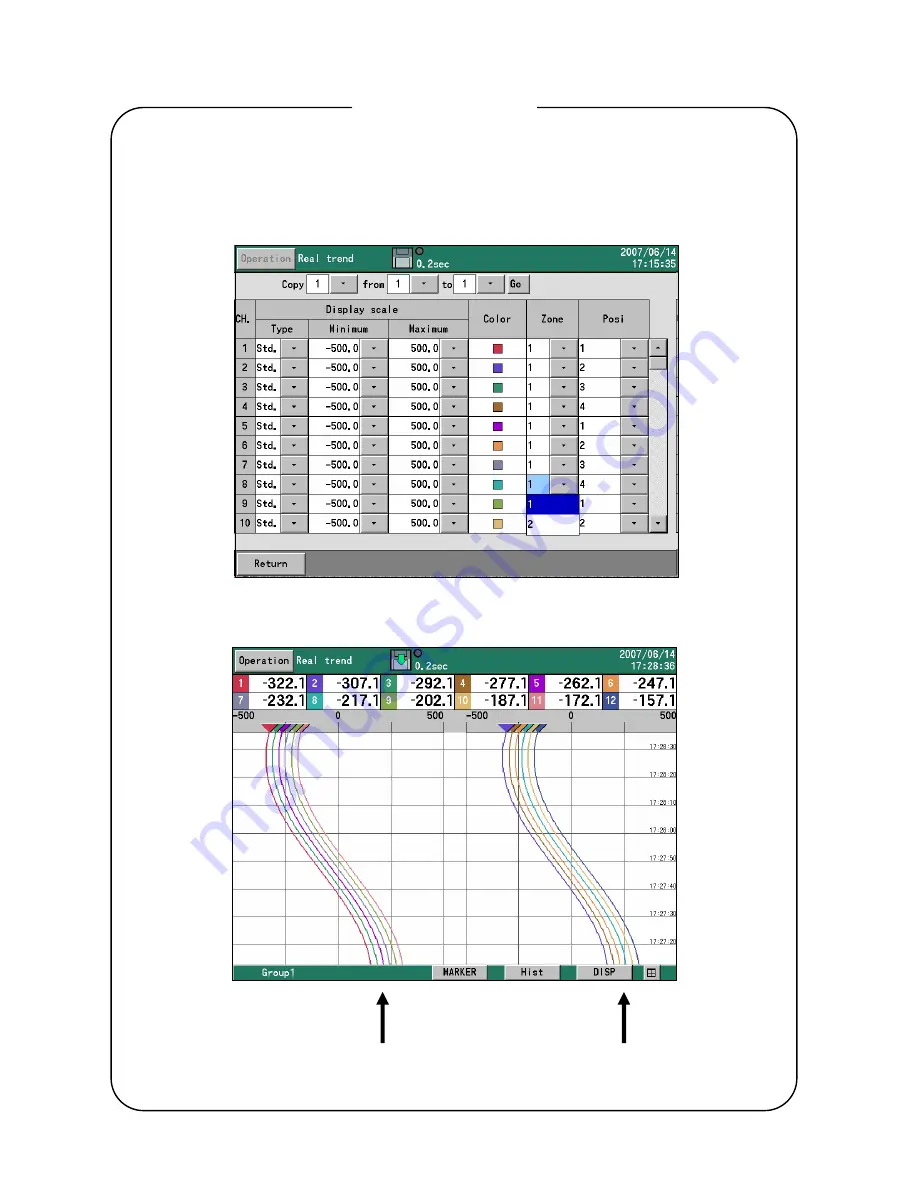
The display range of the measured/calculated data is called zone. Since the data can be
displayed by setting the zone for each channel, the data can be easily read by displaying the
waveforms in separate zones.
Select “ON” in the zone usage. Then, selecting the display settings in the setting menu screen
and selecting the channel parameters, the following screen with the zone added is displayed.
When the zone is set to either 1 or 2, the display of wave format in the trend screen is divided
into 2. Channels set by 1 are displayed in Zone 1 and channels set by 2 are displayed in Zone 2.
Zone 1
Zone 2
Zone


