S3 Cell Sorter Instruction Manual
48 |
1. Right click on the Statistics panel.
2. Click on the statistic name and drag and drop to the new location.
3. Check
Apply to all
to apply to all plots in the protocol.
To alter number of digits after the decimal:
1. Right click in the Statistics panel.
2. Find statistic of interest and change the value in the Precision box.
3. Check
Apply to all
to apply to all plots in the protocol.
4.5.13 Creating Regions
Regions can be created in a histogram or density plot to further identify populations of interest.
A bar region is the only option on a histogram and all other regions will be unavailable. Density
plots may have ellipses, rectangles, quadrant, or polygon regions. There are two ways to create
a region on the plot — by using the Home tool bar or by right clicking on the graph.
To create a region using the Home toolbar:
1. Click on the desired plot.
2. Select the region from the Home toolbar.
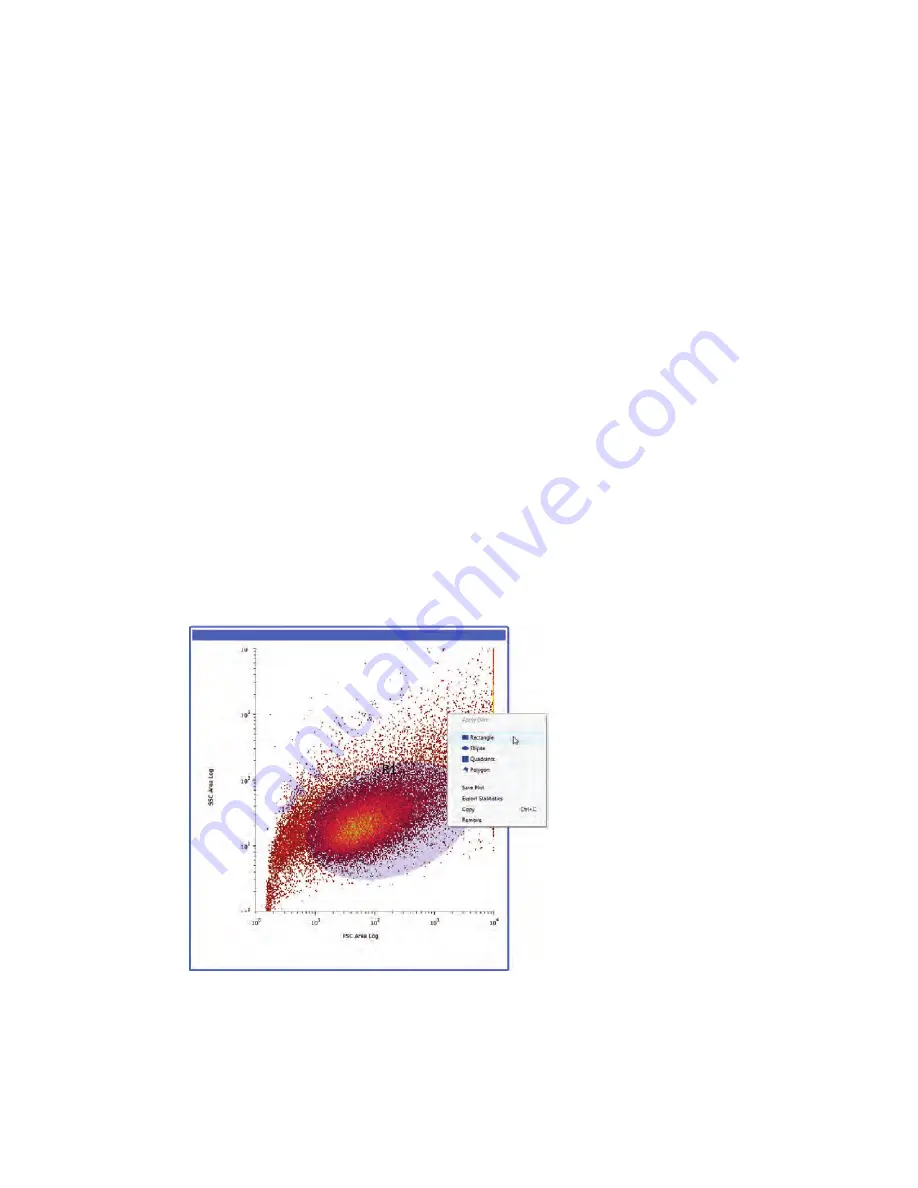
To create a region using the right click on the mouse:
1. Click on the desired plot.
2. Right click within the plot and choose a region type (Figure 51).
The selected region will appear in the desired plot. Region buttons will be grayed out if the
incorrect plot is selected.
Fig. 51. Right-click option for creating regions.
Summary of Contents for 145-1001
Page 1: ...S3 Cell Sorter Instruction Manual Catalog 145 1001 145 1002...
Page 2: ......
Page 8: ...S3 Cell Sorter Instruction Manual vi vi...
Page 10: ...S3 Cell Sorter Instruction Manual viii...
Page 22: ...12 S3 Cell Sorter Instruction Manual 12...
Page 42: ...S3 Cell Sorter Instruction Manual 32...
Page 60: ...50 S3 Cell Sorter Instruction Manual 50...
Page 74: ...S3 Cell Sorter Instruction Manual 64...
Page 82: ...72 S3 Cell Sorter Instruction Manual 72...
Page 96: ...86 S3 Cell Sorter Instruction Manual 86...
Page 112: ...102 S3 Cell Sorter Instruction Manual 102...
Page 114: ...S3 Cell Sorter Instruction Manual 104...
Page 116: ...106 S3 Cell Sorter Instruction Manual 106...
Page 118: ......
Page 119: ......


