User Guide
APconnections, Inc. // 303.997.1300 // www.netequalizer.com
Page 62 of 96
All rights reserved
Copyright © 2014, 2015 APconnections, Inc.
rev. 20150309
View NetEqualizer Log
(
back
)
The NetEqualizer Log File contains a record of the actions of the NetEqualizer. It displays
key activity on the NetEqualizer, such as limits being applied, and penalties being added or
removed. It is viewable from two menus in the NetEqualizer.
To view the NetEqualizer Log from RTR Menus
From the RTR Menus,
Click on ->
NetEqualizer Log
.
To view the NetEqualizer Log from the NetEqualizer Menus
From the Management and Reporting Menu,
Click on ->
View Current Activity
->
[
View NetEqualizer Log
]
.
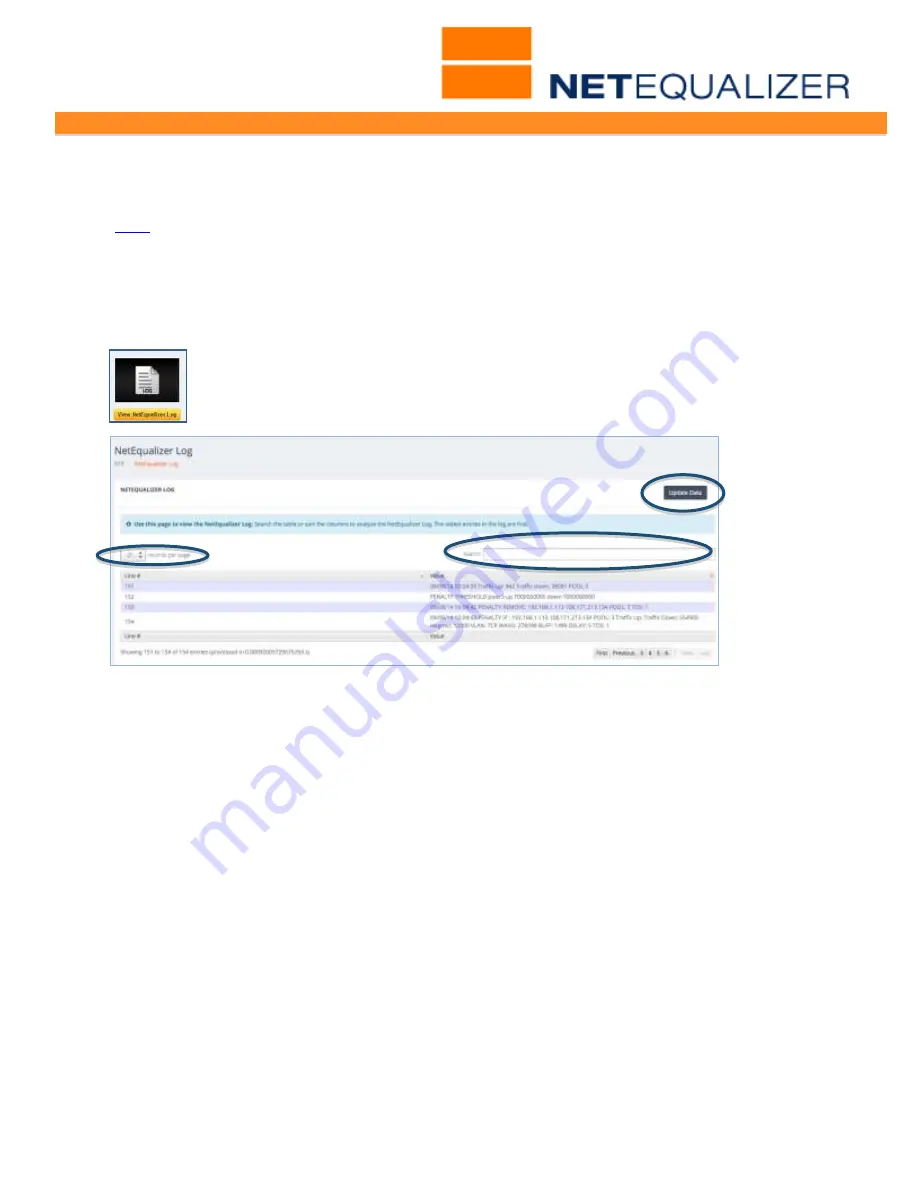
The NetEqualizer Log File screen defaults to displaying 25 rows. You can change this to
10,25, 50, or 100 rows (circled above at top left). If you are looking for item, such as an IP
address, or the word “PENALTY”, you can use the Search field to limit your view to just
those items. And just like other reporting screens, if you want to refresh the data, click on
the “Update Data” button at the top right.
Note: As the newest rows are added to the end of the log file, in 8.1 you should go to the
Last page to see new log entries after clicking on Update Data.
In the NetEqualizer Log File, you will see three main types of entries, discussed below:
1.
Traffic Up and Down
- Traffic flowing on your network in bytes/second.
2.
PENALTY Entries
- Actual penalties being applied. Contains the word PENALTY
followed INCREASE, DECREASE OR REMOVE. Also shows
the connection (IP address pair).
3.
PENALTY THRESHOLD
- For informational purposes only. Not actual penalties.


