User Guide
APconnections, Inc. // 303.997.1300 // www.netequalizer.com
Page 57 of 96
All rights reserved
Copyright © 2014, 2015 APconnections, Inc.
rev. 20150309
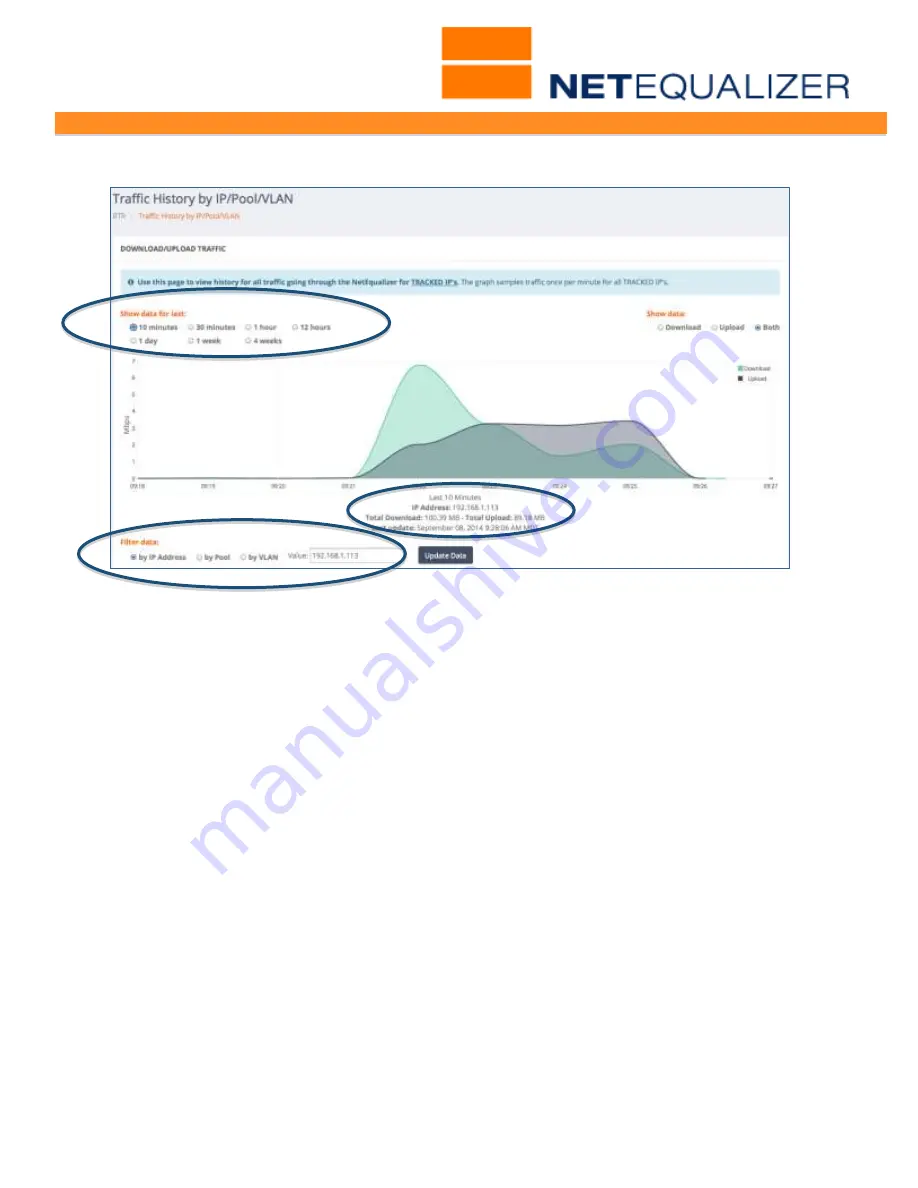
By default, a filter is applied so that the traffic displayed is only for the IP selected, in this
case 192.168.1.113. You can see the filter that is set at the bottom left of the graph. In this
case “by IP Address” is selected, and Value is 192.168.1.113. The traffic shown is in
whatever units have been selected under RTR Preferences -> Traffic by IP/Pool/VLAN Graph
Units. In this case, I have selected Megabits per second (Mbps).
The graph defaults to 1 hour for the last hour. Under “Show data for last” on the top left,
you can change the graph to show 10 minutes, 30 minutes, 12 hours, 1 day, 1 week or 4
weeks of data. In this example, I have updated the graph to show the last 10 minutes of
data.
Radio buttons on the top right can be used to select whether you display download traffic,
upload traffic, or both on the graph.
And finally, below the graph on the x-axis, you can see the amount of data uploaded or
download during the time period displayed for the selected filter, in this case 100.39MB
downloaded and 89.18MB uploaded for 192.168.1.113.
This Traffic Report is a good tool to help you to investigate how much traffic any IP is
consuming. You can change the time period displayed to show data from 10 minutes to 4
week old. In order to get data into this report, you must first have added the IP or IP
subnet to data being tracked, and also Started RTR by going to Start/Stop RTR and clicking
on Start RTR. Both are described in detail in the Traffic Reports section of this User Guide.
Note: By design, the graph does not refresh.
Click on ->[
Update Data
]
below the graph to
refresh your data.


