User Guide
APconnections, Inc. // 303.997.1300 // www.netequalizer.com
Page 51 of 96
All rights reserved
Copyright © 2014, 2015 APconnections, Inc.
rev. 20150309
RTR reports are listed in a vertical menu on the left-hand side of the screen (circled above):
1) Active Connections, 2) Traffic History, 3) NetEqualizer Log, 4) Configuration, 5) Running
Processes, 6) RTR Preferences, and 7) Start/Stop RTR.
You can compress this menu to just displaying icons, or expand it back to show full
menu names by clicking on the compress icon, shown at left and circled above.
You can return to this screen from any other report by clicking on
Clicking on ->
Dashboard
->
RTR
(circled above).
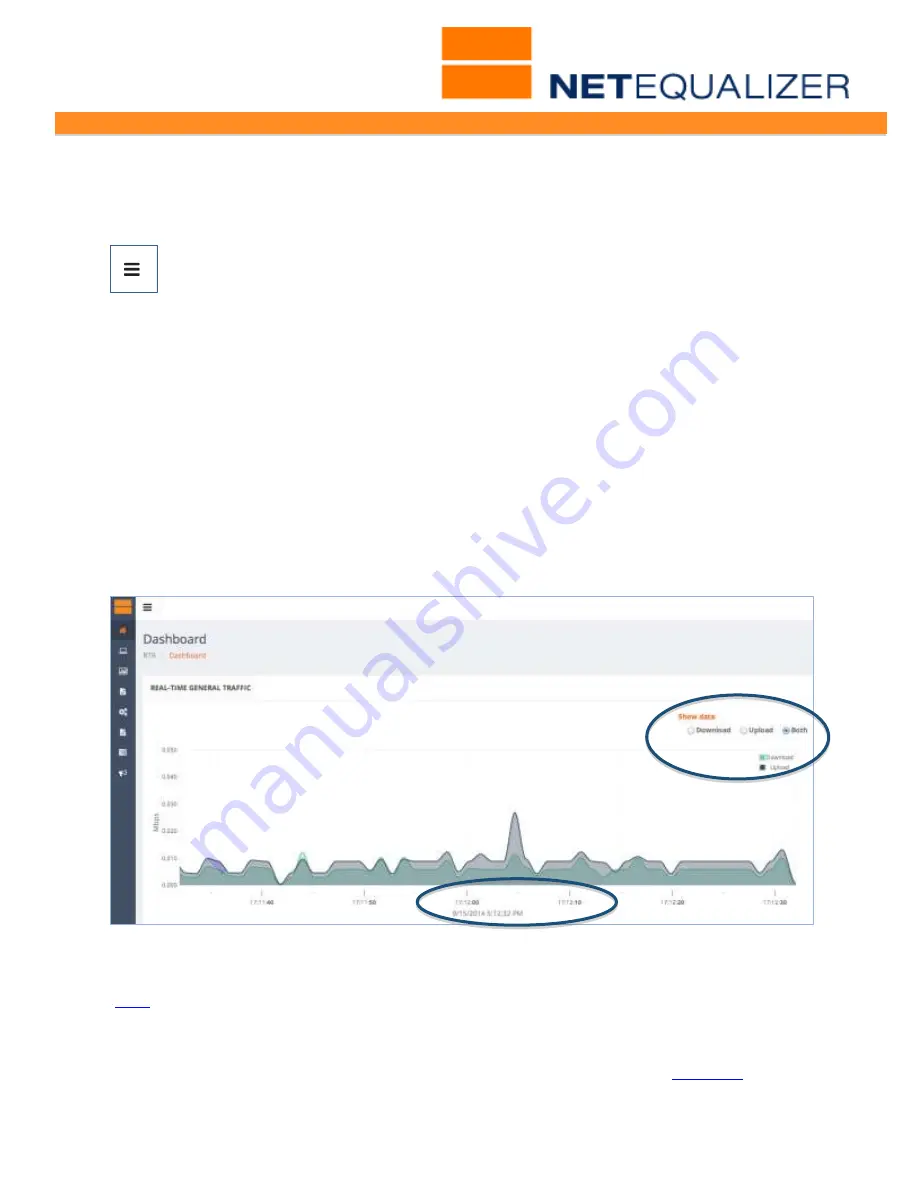
Real-time Traffic Graph
In our graph below, we have compressed the menu down to icons, so that we can focus on
the Real-Time Traffic (RTT) graph itself. On this graph you can see bandwidth consumed for
all traffic flowing through your NetEqualizer. Click on a radio button to see this graph for
Downloads, Uploads, or Both. Each time you come back to the RTR Dashboard, it starts the
graph anew.
On the x-axis, you can see that the scale is set to every 10 seconds, and the Date/Time is
shown below the graph. Date/Time matches whatever is set for your NetEqualizer in
Manage NetEqualizer -> [Configure Date/Time].
RTR Active Connections
(
back
)
Active Connections shows the data streams (pairs of IP addresses) that are currently live on
your network for all IPv4 and IPv6 traffic. This will show all connections your NetEqualizer is
currently seeing. You can utilize this report to see what data streams are "hogging" your
network by looking at the Wavg value. Wavg values over HOGMIN will be
equalized
when
your network is congested.


