background image

8. Define the smoothing levels (in km). 

The 

XY Smoother

 is for the horizontal maximum projection.

The 

XZ Smoother

 is for the side panels and includes values for horizontal smoothing

and vertical smoothing.

In many applications, you may want to use no smoothing so the that maxima are not
diminished by the smoothing filter.

9. For the 

Color Scale

Levels

, and 

1st Level/Step

, type the number of levels, the first level

value, and the level step in 

dBZ

The color levels for the 

Zmax

 display are identical to those defined for the reflectivity.

10. In 

Resolution

, select from the following default values or type other values in the field. 

Resolution

 consists of 3 numbers: the number of E-W pixels, the number of N-S pixels,

and the height of the side panels.

Resolution

Pixels

Height

Low

240 × 240

20

Medium

480 × 480

40

High

720 × 720

60

XHigh

940 × 940

80

Resolution values represent the total size of the display, including the side panels.

More information

Display Parameters (page 27)

Configuring Map Projections (page 19)

Product Parameters (page 23)

Associating Products with Tasks (page 17)

3.10 

MLHGT

: Melting Level Height

The melting level bright band typically represents the location of frozen hydrometeors
falling into air warmer than the freezing level, where the particles start to melt.

Chapter 3 – Configuring IRIS Products

RESTRICTED

47

Содержание IRIS

Страница 1: ...M211319EN H RESTRICTED User Guide IRIS Radar IRIS Product and Display...

Страница 2: ...y given time and hereby disclaims any and all responsibilities related thereto This document does not create any legally binding obligations for Vaisala towards customers or end users All legally bind...

Страница 3: ...LHGT Data Flow with Other Products 54 3 11 PPI Plan Position Indicator 55 3 12 RAIN1 Hourly Rain Accumulation 56 3 12 1 Scheduling RAIN1 Products 57 3 13 RAIN N N Hour Rain Accumulation 59 3 13 1 Sche...

Страница 4: ...130 5 2 2 System Manager Preparations for Composites 131 5 2 3 Configuring COMP 132 5 2 4 WARN Algorithm 136 5 2 5 COMP Scheduling 137 5 3 DWELL Algorithm Composite in Time 139 5 3 1 DWELL Algorithm E...

Страница 5: ...s only 231 6 14 Track Annotate Tool 232 6 14 1 Creating and Editing a Track 234 6 14 2 Adding and Editing Annotation Text 237 6 14 3 Adding and Deleting Tracking and Annotation Icons 238 6 14 4 Tracki...

Страница 6: ...flectivity 297 A 3 Geometry 298 A 4 Problems in Interpreting Radar Images 299 A 5 Doppler Wind Measurements 300 A 6 Clutter Cancellation 300 Appendix B Radial Velocity Correction 302 B 1 Radial Veloci...

Страница 7: ...are 347 D 7 6 Ribbon Display Testing with tdwr_sim 351 D 7 7 Ribbon Display Alert Messages 353 D 8 TDWR LLWAS Integrator and Runways Utility 353 D 8 1 Configuring Integrator and Runways Utility runway...

Страница 8: ...le Profile Correction against Range 81 Figure 27 THICK Example Configuration 84 Figure 28 TOPS Example Configuration 86 Figure 29 Example of 15 tilt Volume Scan 87 Figure 30 TRACK Example Configuratio...

Страница 9: ...w size with range rings and overlay 202 Figure 76 Quick Look Window 207 Figure 77 Example Live Action Tool for CAPPI 208 Figure 78 Color Scale Tool 211 Figure 79 Display Options Menu 214 Figure 80 Pro...

Страница 10: ...cted Areas for TDWR 339 Figure 120 Dale Ribbon Display Installation 344 Figure 121 Dale Ribbon Display Controls 344 Figure 122 vribbon Display 346 Figure 123 Ribbon Display Setup Menu 350 Figure 124 T...

Страница 11: ...tions for Generating Radar Products 120 Table 15 Optimizing Scan Task for DWELL Target Detection 153 Table 16 Suggested Input Product Types for Target Warning 154 Table 17 Optimizing Input Products fo...

Страница 12: ...IRIS Product and Display User Guide M211319EN H 10 RESTRICTED...

Страница 13: ...IS Focus User Guide M211850EN IRIS Focus Administrator Guide M211904EN IRIS Focus Release Notes M211315EN IRIS and RDA Software Installation Guide M211318EN IRIS Programming Guide M211316EN IRIS and R...

Страница 14: ...ard If you do not read and follow instructions carefully at this point the product could be damaged or important data could be lost CAUTION Note highlights important information on using the product T...

Страница 15: ...ray of direction and intensity vectors used to shift a current weather display interactively GAGE1 The GAGE product stores reports from rain gage sensors for display and use in product generation Thes...

Страница 16: ...TAT Radar System Status A STAT file contains a report indicating the state of all key components of the radar software THICK Echo Thickness THICK shows the thickness of cloud echoes THICK is the same...

Страница 17: ...H 1 Cross Section CATCH calculates the precipitation accumulation in subcatchment areas such as watershed areas This product requires the Hydromet option COMP Multi Radar Site Composite COMP produces...

Страница 18: ...ur map of the height of a selected reflectivity surface The RAIN1 and RAINN products show the accumulation of precipitation over selectable time periods The WARN product checks other IRIS products to...

Страница 19: ...red Product Parameters Specifies the data range and other product specific options Display Parameters Select your default color scale which can be overridden at display time In case of HClass data typ...

Страница 20: ...our disk In this case type the task name directly in the field exactly as it appears in the Ingest Summary menu or the Tape menu RHI products Include RHI in RHI task names to distinguish them from PPI...

Страница 21: ...0 6 mi wide at 60 km 37 3 mi so this scheme matches the antenna resolution If close range work is important you must add higher elevation angles to cover the upper regions 0 5 10 10 20 30 40 50 44 9...

Страница 22: ...191 In IRIS Focus this is used to display single radar data Mercator2 Choose this for true Mercator projection mapping where latitude and longitude lines are straight and intersect at right angles Ad...

Страница 23: ...t of the time you do not need to create or use special projection files If you want the radar off center you must configure a projection file as described starting from step 3 If you have already conf...

Страница 24: ...to the radar location For Mercator projections The map cannot cross the line 180 away from this longitude so set it near your location The latitude defines the range scale For Polar Stereographic The...

Страница 25: ...efault to load some valid numbers 10 Specify the pixels The number of pixels that are used to represent data in the projection is specified for the X and Y directions of the output display If you have...

Страница 26: ...l CSR ratio of dBT to dBZ dBT dBTh dBTv DBTr Total power dBZ Clutter corrected reflectivity dBZt Uncorrected reflectivity HCLASS Hydrometeor classification Estimated hydrometeor type in the precipitat...

Страница 27: ...and its Doppler lag 0 indicates white noise 1 is the perfect Doppler point target T Total Reflectivity Total power returned to the radar in reflectivity units It typically represents the horizontal r...

Страница 28: ...product output menu This is because the maximum range is determined by the projection configuration See Configuring Map Projections page 19 This is the maximum range configured for the product which...

Страница 29: ...60 pixels much longer than you probably want to use CAUTION To produce many smoothed products in a regular operation Vaisala suggests the following Use low resolution products together with smoothing...

Страница 30: ...u to choose which classifier outcomes are projected in the product The selector lists the available classification algorithms and their merged combinations Color Scale Levels 1st Level Step The color...

Страница 31: ...Parameter Formats Display Parameter 1st Level Step Format dBZ XX Whole dBZ dBZt XX Whole dBZ Rain XXX X mm hr Liq XXX X MM Vel X X m s Width XX X m s ZDR X X dB TOPS XX X km VIL XX X mm WIND NA SHEAR...

Страница 32: ...Note that both ends are set to saturate for velocity The format of the color legends with regard to how the numerical legend labels relate to the color band boundaries is configured in the Color Setu...

Страница 33: ...HI formats rectangular image region with legends beneath The defaults are optimized to the resolution of the standard IRIS display devices Table 10 Default Picture Resolutions Default Resolution RHI R...

Страница 34: ...ter to lesser value The final output of the product is a color coded map of echo base heights for the selected dBZ contour Optional Cartesian smoothing can be applied C S and X band radars detect prec...

Страница 35: ...m range for the product Recall that earth curvature effects are greater at greater ranges You can display a PPI at your lowest elevation angle and use the cursor tool to see what heights are possible...

Страница 36: ...cally turned off for this The BEAM product can then be used to display the antenna response to the radiator Calibrated sphere measurement Similar to above except the radar is radiating The sector scan...

Страница 37: ...55 km 34 2 mi 4 In Min Max E L define the elevation window For example if the volume scan has elevation angles between and including 0 and 5 enter the values 0 0 and 5 0 5 In CW AZ Interval define th...

Страница 38: ...n at multiple elevation angles The number of angles and their spacing depends on the range and height of the CAPPI you want to produce CAPPI also supports calculation of SHEAR data The configuration o...

Страница 39: ...er than 5 km 3 1 mi in this region Similarly if you pick a low level CAPPI surface the lowest elevation angle is higher than the surface at far ranges The resulting product display shows these unsampl...

Страница 40: ...mple 30 dBZ is selected 4 Specify the Correlation threshold The correlation algorithm returns a speed direction and a correlation value which serves as a quality indicator The value that you enter her...

Страница 41: ...he size of the input product in km For example if the input product has a 200 km 124 3 mi range 400 km 248 5 mi total span and the output resolution is 5 km 3 1 mi then the output is a grid of 80 80 m...

Страница 42: ...ce and height of the bright band In animation rapidly decreasing heights in convective storms may indicate the presence of a microburst A limitation of the HMAX product is described in the note below...

Страница 43: ...for earth curvature over a given range and at a given azimuth that intercept the PPI scans of the volume scan including one point above and below 2 If the data is Z it linearizes it If the output is...

Страница 44: ...2 In Data Display select the type of data that is computed To compute VIL Density data select one of the following dBT VILDen dBZ VILDen dBZc VILDen To compute a layer average select any other data t...

Страница 45: ...ice More information VIL Vertically Integrated Liquid page 93 3 9 MAX Maximum Data with Side Panels MAX shows the maximum data over each pixel as well as the East West and North South maximum projects...

Страница 46: ...the radar cannot see to the surface of the Earth there are curved boundaries at the bottom of the side panels MAX is based on a volume scan task and is calculated as follows IRIS Product and Display...

Страница 47: ...um data values for the horizontal and vertical projections East West and North South The horizontal maximum projection is calculated from the highest data value in a user specified layer over each pix...

Страница 48: ...Display select the input data Available data types include dBT dBZ dBZc V Vc W ZDR ZDRc and Kdp Rainrate can be output for the appropriate types 6 Define the Max Range The Max Range corresponds to th...

Страница 49: ...m the following default values or type other values in the field Resolution consists of 3 numbers the number of E W pixels the number of N S pixels and the height of the side panels Resolution Pixels...

Страница 50: ...d with the melting level must be accounted for with quantitative interpretations of weather observations In IRIS and RDA software the SRI product uses the melting level height to perform Vertical Refl...

Страница 51: ...thm IRIS dual polarization raw volume data is used as input for the MLHGT algorithm This data may come from either single PPI volume RHI or sector scans The algorithm also functions independently from...

Страница 52: ...r precipitation by a dedicated fuzzy algorithm known as MeltClassifier MeltClassifier is similar to the MeteoClassifier used in HydroClass However the MeltClassifier substitutes a Signal to Noise Rati...

Страница 53: ...onfidence remains low Once the minimum confidence is reached the melting level height form MLHGT is assigned to that region else the height remains to be the climatological value The Bayesian inferenc...

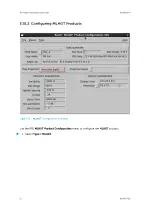
Страница 54: ...ing MLHGT Products Figure 14 MLHGT Configuration Example Use the IRIS MLHGT Product Configuration menu to configure the MLHGT product 1 Select Type MLHGT IRIS Product and Display User Guide M211319EN...

Страница 55: ...fines how many column sectors exist in the 360 of view For example if you add a value of 24 there are 24 columns for each range interval each having a size of 15 360 24 15 By specifying a small base s...

Страница 56: ...he first MLHGT product according to the saved configuration and saves it as a file IRIS then manages this product file in a similar to other types of products Figure 15 MLHGT Data Flow for Use with Ot...

Страница 57: ...PI shows data from one elevation all azimuths You can use it at the radar site for quality control 1 On the IRIS menu select Menu Product Configuration 2 Select Type PPI 3 Select the button next to TA...

Страница 58: ...te of the rainfall that fell in that hour The results can be displayed or used to derive the RAINN or CATCH product A general purpose volume scan task usually serves for the rainfall product Note that...

Страница 59: ...ime period for rainfall accumulation Generally 60 minutes is used to produce a one hour rainfall product but you can use shorter intervals The minimum accumulation time is 15 minutes 6 If you have pur...

Страница 60: ...tical bar represents an the next accumulation period Case 1 Normal Case Next hour CAPPI Arrives C C C C C C C C The RAIN1 product is run as soon as a CAPPI from the next accumulation interval arrives...

Страница 61: ...a product You can sum any number of hours of individual RAIN1 products The only limitation is the number of RAIN1 products stored on disk The product output shows the last N hours of accumulation 1 Se...

Страница 62: ...ct are quantized to the time value in the product configuration for the nearest interval that ends the integration Use the Skip Time field if you want only the accumulations for specific time interval...

Страница 63: ...oduct on the available RAIN1s without the current hour data If the current hour RAIN1 eventually arrives it does not trigger the scheduling algorithm since the Next Data Time in the Product Scheduler...

Страница 64: ...ontains all the information collected during a measurement task It is compressed so it can be sent over the network to IRIS Analysis While RAW data cannot be displayed it is useful for recording on ta...

Страница 65: ...product files over a slow network connection select Make sweep by sweep On 5 To filter the RAW product to only include some of the data types of the original data deselect Include All Data For example...

Страница 66: ...l e s f r o m3 0 3 0 t o 3 1 3 0E l S e c t o r Figure 20 RHI Example Configuration RHI is a full screen image showing the detailed cross sectional structure of a storm used for identifying severe st...

Страница 67: ...eep that angle is used for the RHI product If you enter to the field the product is made for every azimuth in the associated task 5 In Max Height XZ Smoother and Range filter specify the Max Height fi...

Страница 68: ...vely growing Cb with top at 13 km 8 1 mi The echo over hang and weak echo region on the right indicates a well organized strong inflow and vertical motion both characteristic of a severe thunderstorm...

Страница 69: ...along the polar volume Note that you cannot get below the lowest elevation Resolution Typically RHI gives a much better resolution Schedule If the user of the radar images can control the tasks they...

Страница 70: ...h case the RTI product shows a time height cross section of the atmosphere The following example shows an RTI and a PPI from the same situation From both pictures the maximum range is 50 km 31 1 mi an...

Страница 71: ...Chapter 3 Configuring IRIS Products RESTRICTED 69...

Страница 72: ...e elevation angles in the task The angels are listed in the upper part of the menu 5 In TR Smoother define the smoother in XY directions of the RTI image Typically a small value is used for research p...

Страница 73: ...near melting layer where the echo is much stronger Thus a correction is needed to estimate surface rainfall intensity IRIS SRI allows you to apply your local knowledge by providing ways to input infor...

Страница 74: ...l intensity at each pixel is calculated by finding the lowest clutter free bin and bringing the measured reflectivity there down to reference level by making 2 corrections 1 The correction for the bea...

Страница 75: ...u can define the reflectivity profile with the following parameters Reflectivity gradient above the melting layer 7 dBZ km 11 3 dBZ mi Reflectivity gradient below the melting layer 1 dBZ km 1 6 dBZ mi...

Страница 76: ...ting level height assuming the moist adiabatic lapse rate 6 5 C km This lapse rate is a good estimate during the precipitation event If nothing else is available start with the following table Table 1...

Страница 77: ...dar If you cannot change the profile frequently and the temperature fluctuates below and above 0 with bright band appearing and disappearing Vaisala recommends you apply the snow profile as described...

Страница 78: ...spd_melts 1 20 testfile echo iris_setup misc ifallspd_melts 2 25 testfile cat testfile setup_change load Alternatively put several name value pairs in the same string if separated with n You can ssh t...

Страница 79: ...Configuration Example SRI provides input for the RAIN1 product to obtain the best possible estimates of accumulated precipitation even at longer ranges from the radar 1 Select Type SRI Chapter 3 Conf...

Страница 80: ...med You must set a reasonable level such as below 5 km 3 1 mi Note that at far ranges when the lowest beam is above the Max Height the lowest beam is used 5 To use a profile in the correction enable U...

Страница 81: ...value the more often pixels are considered convective Disable Convection to have all precipitation corrected with the above given profile More information Configuring Map Projections page 19 Display P...

Страница 82: ...profile in the case of the example Note that at high altitudes the profile soon reaches values below the minimum detectable signal MDS and or the cloud top IRIS Product and Display User Guide M211319E...

Страница 83: ...errain Map File The terrain maps are stored in the surface_height conf file in the IRIS_CONFIG directory This file contains information for each radar site stored in an ASCII polar format Here are the...

Страница 84: ...Joss J and Germann U 2000 Three Methods to Determine Profiles of Reflectivity from Volumetric Radar Data to Correct Precipitation Estimate Journal of Applied Meteorology 39 10 1715 1726 3 18 STAT IRIS...

Страница 85: ...task slaving Status Prod maximum file count Type the number of status product files to be kept on the system STATUS product receive timeout Select Disabled or Enabled If enabled set this time slightl...

Страница 86: ...n email to a cell phone 3 19 THICK Echo Thickness Product Figure 27 THICK Example Configuration THICK shows the thickness of cloud echoes THICK is the same as the difference between the TOPS and BASE...

Страница 87: ...ranges For example for a 0 5 elevation angle at 100 km 62 1 mi the beam is centered at 2 3 km 1 4 mi Therefore it is not possible to detect echo bases lower than this 4 In dBZ Contour select the dBZ t...

Страница 88: ...r FULL or SECTOR The TOPS product is an excellent indicator of severe weather and hail For example a 50 dBZ top 1 km 0 6 mi above the freezing level can be produced only by a vigorous convective storm...

Страница 89: ...evation angle at the same surface range is used to interpolate the height of the contour that must lie in between Undetected Echo Aloft If there is no detectable echo in the next higher ray aloft then...

Страница 90: ...entroids based on a series of input products from different times The TRACK product consists of a series of track points connected by lines or tracks Each track shows the motion of one centroid over a...

Страница 91: ...nformation is used to define the new TRACK product including the forecast point Warnings are issued if a centroid hits or is forecast to pass through a protected area As new data comes in the TRACK pr...

Страница 92: ...is processed points that are older than this time span are removed You set the time using the plus and minus button to increase and decrease the hours or minutes Select Ok to exit the window The time...

Страница 93: ...o Setup you must restart IRIS for the change to take effect TDWR Style IRIS supports two formats of warning messages In TDWR format only the strongest centroid in the highest priority area is reported...

Страница 94: ...to average the velocities The VAD product averages all velocities in this range for all rays and store a structure for each ray This structure includes the average value standard deviation data count...

Страница 95: ...tation aloft that is not reaching the ground which can be missed by a PPI or CAPPI If the layer height is above the freezing level high VIL values are an excellent indicator of severe storms and hail...

Страница 96: ...ayer Average Reflectivity LAR data the output is stored in normal reflectivity The processing is nearly identical to VIL data except that the dBZ inputs are converted to linear Z instead of W and we d...

Страница 97: ...task passes through the VIL layer no VIL can be calculated For a VIL layer of 5 to 10 km 3 1 to 6 2 mi in the volume scan example in the following figure VIL cannot be calculated for ranges less than...

Страница 98: ...o vertical air motions Horizontal deformation and axis of dilatation related to frontal forcing Average reflectivity Average RhoHV You can select which data is calculated and store the resulting produ...

Страница 99: ...ated by taking the average of the radial velocity Other kinematic parameters can be estimated such as the deformation and the axis of dilatation of the wind 0 North Mean Wind South West East Vu Vu Eas...

Страница 100: ...st squares fit for each height interval The maximum allowed is 10 000 bins Vaisala recommends using the maximum of 10 000 If you only select the mean velocity that is vertical velocity divergence and...

Страница 101: ...ailable VVP displays in IRIS are Line graphs against height Up to 5 parameters can be selected for plotting against height Standard deviation bars are included on the plots Time height cross sections...

Страница 102: ...there is a high probability of hail To avoid issuing an alarm based on a single pixel a threshold region parameter checks if the region of hail signature at least 10 km2 The VIL for the same region 1...

Страница 103: ...beep are broadcast to all IRIS terminals 5 Produce the WARN a situation display also called an overlay display because it can be overlaid on any X Y product display as selected in the Product Output m...

Страница 104: ...detected in a protected area the warning message is displayed in large characters across the bottom of the screen The time associated with each warning is also displayed If more than one hit is detect...

Страница 105: ...8 in s AND Reflectivity 20 dBZ over an area of 10 km2 3 9 mi2 Hail detection 45 dBZ TOPS 1 5 km 0 9 mi above freezing level over an area of 10 km2 3 9 mi2 Precipitation surveillance detection 1 5 to 1...

Страница 106: ...damages of any kind for failure of the WARN product to issue a warning or for false alarms that may be issued by the WARN product More information WARN Algorithm page 136 3 25 1 Configuring WARN Prod...

Страница 107: ...play For example the text may be HAIL or MBW S or TRW 4 Enter the minimum size of a thresholded region in the Area in Sq Km field Areas that do not meet or exceed this size are discarded Enter the des...

Страница 108: ...of the same task Use the plus and minus buttons to increase or decrease the hours minutes or seconds or type a time value in the window This field applies only when there is more than one criterion F...

Страница 109: ...angle There is a limit of 16 areas If you make a change to Setup you must restart IRIS for the change to take effect It is a good idea to make a large area for example 500 by 500 km 310 7 310 7 mi nam...

Страница 110: ...harp gradients such as fronts or microbursts The output can be displayed as wind barbs or wind strings as an overlay product The mean wind can be subtracted at output so that the perturbation wind is...

Страница 111: ...ing is set to 10 km 6 2 mi and the Azimuth Spacing is set to 45 a wind vector is computed over the Min Max Range every 45 in azimuth and 10 km 6 2 mi in range 5 Set the Sector Length and Width values...

Страница 112: ...ypically composed of about 100 elevation angles the resolution in an XSECT is limited by the number of elevation angles in the volume scan typically 10 20 However the 3 D interpolation used by the XSE...

Страница 113: ...de 10 Height 0 Orientation Angle 50 0 If Angle is set to 50 180 230 left and right sides of XSECT display are swapped Cross Section Configuration Parameters Cross Section Display Parameters Figure 41...

Страница 114: ...f 50 180 230 6 In XZ Smoother set the X and Z smoothing length scales independently Because of the interpolation performed in constructing the cross section product the output displays usually require...

Страница 115: ...he network or from a tape If the Display field is set to Master the Master Schedule there is only one product entry regardless of the number of sites scheduled Right click the mouse to show a menu on...

Страница 116: ...is being generated or Wait product is waiting for either the associated task to run for its turn to run pending the completion of other products or the product is not scheduled to run After a product...

Страница 117: ...for which the product is added Value Description All Sites Add the product for all sites Site Group Add the product for all sites defined by the Site Group Tag with the members of the site group If yo...

Страница 118: ...after the next data time are processed The product is generated on an on going basis when the task collects data subject to the Skip time Next Only data from the next occurrence of the task after the...

Страница 119: ...ime Interval The default value of the Skip field is 00 00 indicating no tasks are skipped When the Master Schedule is displayed a change in the Skip Time is applied to all of the sites You must consid...

Страница 120: ...ps the selected product s schedule When the Master Schedule is displayed a change in the Request is applied to all of the sites 8 To generate products from old data right click the Next Data Time fiel...

Страница 121: ...ion 1 Select the product you want to edit 2 Position the mouse cursor over the Product field and choose Edit IRIS opens the Product Configuration menu with the selected product loaded into it 3 Edit t...

Страница 122: ...lution sampling in azimuth and range do not sample at ranges greater than you need for your application Custom products If users want to request many custom products consider purchasing a separate wor...

Страница 123: ...calibration The subcatchment areas are defined similarly to overlays that is subcatchment regions are defined by using LAT LON vector points and stored in a file in the IRIS_OVERLAY directory A catch...

Страница 124: ...u l l A z F u l l C i r c l e E l 3 a n g l e s f r o m0 5 t o 4 0 7 0 0 2 Z T V WZ D R K p d P D P R H V S Q I Z v T v S N R Z e T e Figure 43 CATCH Example Configuration 1 Select Type CATCH IRIS Pro...

Страница 125: ...ier Use these values to modify the thresholdsfor each subcatchment This might be done to account for different integration times For no adjustment of the thresholds in the subcatchment file set Offset...

Страница 126: ...rst point and the last point must be the same Subcatchments that share the same boundary must be entered as complete closed regions that is the shared boundary points are the same for adjacent subcatc...

Страница 127: ...ded pixels are treated as 0 rainfall The result is the average hourly rainfall for the subcatchment 2 This is repeated for each hour and each subcatchment 3 The sum over all hours in the integration t...

Страница 128: ...or coded subcatchment map regions where the color code shows the precipitation depth see example above The color scale is the rainfall depth scale in mm or inches Colored icons where the icon a rainga...

Страница 129: ...o choose a display style select Quick Look Window Options 4 Right click the mouse on a subcatchment A bar graph appears showing the hourly precipitation accumulation for the integration time 5 To sele...

Страница 130: ...cture Fill in blind spots caused by mountains or required sector blanking Fill in blind spots caused by scan strategy limitations for example not scanning to high elevation angles Simplify product man...

Страница 131: ...utomatically remapping the input products to the final output projection and resolution This means that you can input products that have different pixel resolution center position and maximum range ev...

Страница 132: ...same type for example CAPPI and have the same name This is the recommended way to manage products on your network in general Note that IRIS sorts everything by site for you so there is no need to put...

Страница 133: ...e to the radar site Data from closer radar sites have a bigger impact to the final value than data from sites farther away You can choose the combining algorithm in the COMP Product Configuration Menu...

Страница 134: ...5 2 3 Configuring COMP Figure 46 COMP Configuration Example IRIS Product and Display User Guide M211319EN H 132 RESTRICTED...

Страница 135: ...have this name IRIS only allows you to composite the following products that are licensed on the compositing computer BASE CAPPI including 3D CAPPI dBZ and R HMAX MAX side panels are removed PPI dBZ a...

Страница 136: ...ated with the product It is also used for filling data in overlapped regions if you select the Priority combining rule 3 In Output Site ID specify the site used to identify the composite This does not...

Страница 137: ...the start of the volume scan the Data Time For PPI it is the actual sweep time A value of 5 minutes is probably close to the maximum that you would typically allow If you are unsure consider how quic...

Страница 138: ...RN products is determining which of the input centroids are really the same feature and which are different We do this with the adjustable Centroid Distance specified in the Product Configuration Menu...

Страница 139: ...id is used More information WARN Warning Centroid Product page 99 5 2 5 COMP Scheduling A B A Run on AB only if elapsed Time is more than allowed B A Run on ABC C A and or B Run on A and or B C Run on...

Страница 140: ...heduler advances the next data time pointer to just after the data time of the latest product Note that only the radar computers must have their times synchronized The system clock on the compositing...

Страница 141: ...oduct algorithm is a time composite of the input products Because of this the product that is generated by the DWELL algorithm is of the same type as the input product For example if we dwell a PPI pr...

Страница 142: ...DWELL Algorithm Examples DWELL is comprised of a product and composites successive images of a product in time Moving targets show a streak on the display The example shown here is for DWELL applied t...

Страница 143: ...the PPI products for the preceding 2 hours This is useful to show where precipitation has fallen during the DWELL period The animation shows the expanding field of fallen precipitation and the echo m...

Страница 144: ...so that blue shows the most recent echoes while red shows the oldest echoes The example shows blue on the left West where the current echo is located The red echoes on the right East are the older ec...

Страница 145: ...gorithm in the Product Scheduler When the Product Scheduler detects an input product beyond the Next Data Time this product and all products from the same site within the specified dwell time for exam...

Страница 146: ...exceeding the corresponding data value in the computed background field plus a selectable threshold For velocity the absolute value of the difference between the background field and input product pix...

Страница 147: ...a natural power fluctuation and these are better removed by the contrast filter if the background field is based on maximum that is the background field has larger values so that fewer weather speckle...

Страница 148: ...f the average background echoes When this is subtracted from the input products and thresholded in applying the contrast filter the background echoes are removed leaving only the high intensity cores...

Страница 149: ...r the main output the diagnostic USER product is for the time TIM suffix If time is selected for the main output the diagnostic USER product is for the input data type DAT suffix USER productname CON...

Страница 150: ...Target Detection Disabled 1 Select Type DWELL 2 To name the DWELL product select File Save As Vaisala recommends that the name of the DWELL product be the same as the input product with a D appended t...

Страница 151: ...ducts using PPI as an input product select the Data Type If you select the Dwell Output to be Data for example in the lower left corner the DWELL version of the PPI is made for this data type In the e...

Страница 152: ...e background field is produced by a smoother that averages data pixels in a 10 km by 10 km 6 2 mi by 6 2 mi box that is passed over all the pixels in the first pass DWELL product If the percentage of...

Страница 153: ...be created for the warning 2 The time DWELL points are shifted back in horizontal space according to a trial velocity vector Targets that are moving at a constant velocity are piled on top of each oth...

Страница 154: ...rial 2 WARN Trial 3 WARN Trial 4 WARN Trial 1 WARN t0 t 1 t 2 t 2 t 1 t0 Make Dwell Time Product Check Each Trial Motion Vector for Targets Combine Warnings from All Trial Motion Vectors and Then Chec...

Страница 155: ...r second trip echo and noise be eliminated The update rate should be fairly rapid to resolve the target motion and provide more continuous information on the target locations Some knowledge of the lik...

Страница 156: ...different velocity than the air so that provided the targets are stronger targets they produce a velocity anomaly which can be passed by the contrasting algorithm If the motion of the target is perpen...

Страница 157: ...90 km 55 9 mi diameter and 0 125 m 5 in per pixel Product smoother Must be set to 0 This is so that isolated single bin targets are not removed 5 3 6 Configuring DWELL Products with Target Detection...

Страница 158: ...ets is used during the pile process to add up targets that are moving at the expected velocity The velocity of the targets is the result of the target s flight air velocity and the wind These fields a...

Страница 159: ...t and a suffix indicating the type of diagnostic DAT or TIM CON and PIL See Applying the DWELL Algorithm to Product Scheduling page 143 More information Configuring DWELL Products with Target Detectio...

Страница 160: ...n A product pixel resolution of 720 x 720 is used to match the 125 m 410 ft 1 in input data resolution The following figure shows an example of a 3 elevation PPI There is a clear air echo only and win...

Страница 161: ...e DWELL is 10 minutes Note that aggressive clutter filtering has removed nearly all of the clear air echo at 0 velocity Note that only the large scale echoes are included in the background field This...

Страница 162: ...und field A contrast threshold of 1 m s 3 ft 3 in s was used that is only data points that differ from the background field by more than 1 m s 3 ft 3 in s are included in the DWELL PPI product This sh...

Страница 163: ...treaks of motion from northeast to southwest This is even more apparent in animation since the streaks move across the screen to the Southwest The random noise shows a chaotic speckled pattern in time...

Страница 164: ...12 m s 39 ft 4 in was selected by inputting only these values into the limits for the speed and direction ranges The results show that the coherent streaks of echo as seen in the DWELL time display ar...

Страница 165: ...the flock The height information is only available for track detection based on PPI input products since there is no height information available from the other input products that can be used for DW...

Страница 166: ...h is also rotated to the direction of motion The prior warning icon name is made by appending d short for dwelled to the primary icon In this case we get birdd xbm The result is a track style display...

Страница 167: ...orts from all the rain gages locations and hourly precipitation amounts for one time interval Usually the time interval is one hour but it can be for example 15 minutes The display shows a color coded...

Страница 168: ...gage can at the location of each gage Each gage is colored with the color for the rainfall accumulation measured by the gage See the previous figure for an example of this display with radar data unde...

Страница 169: ...p to 10 rain gage datagrams simultaneously This allows you to compare different gages or RAIN1 products 5 5 NDOP Multiple Doppler NDOP provides a mechanism for including velocity Doppler data from ano...

Страница 170: ...e two radars essentially measure the same radial wind While in theory the crossing angle could be anywhere between 0 and 180 our radial velocity measurements are not perfect so that in practice a cros...

Страница 171: ...er 1 to 10 m s 2 to 20 knots for rain can make a significant contribution to the radial velocity Therefore it is necessary to correct the radial velocities for the effect of fallspeeds The effect of p...

Страница 172: ...assumes that the wind field varies linearly with distance from the radar The VVP product used by Vc must have the special name UNFOLD and must be available on the system where the unfolding is being p...

Страница 173: ...5 5 2 Configuring NDOP Products Figure 59 NDOP Example Configuration Chapter 5 Configuring and Scheduling Optional IRIS Products RESTRICTED 171...

Страница 174: ...When the NDOP products appear in inventories such as the Product Output Menu or Quick Look Window they are associated with this site e In the TASK time Window specify is the maximum time difference t...

Страница 175: ...Grid In the example the Range Span is 40 and the grid is 16 therefore the resolution is 2 5 km 1 6 mi The actual number of points in the output array that is made by NDOP depends on the aspect ratio o...

Страница 176: ...hrough the mountain pass to the North of Hong Kong The points in the display show the regions where the crossing angle criterion was met These regions are on either side of the baseline that connects...

Страница 177: ...uing the example with 4 pixels per km in the CAPPI and a an output resolution of 2 km 1 2 mi we would average 8 8 32 wind vectors for each output grid point 4 To eliminate noise and speckle effects a...

Страница 178: ...a roughly circular region typically less than 3 km 1 9 mi in size Gust Fronts Caused by cold outflow from a convective storm perhaps a microburst colliding with the surrounding air They are character...

Страница 179: ...positive Azimuthal shear Computed by differencing the radial velocity in azimuth Positive values are for radial velocity increasing more away in the clockwise direction This corresponds to positive v...

Страница 180: ...SHEAR product is only one of many indicators that such a hazardous condition may exist Normal precautions to avoid suspected wind shear should be used even if the SHEAR algorithm does not detect shea...

Страница 181: ...evation angle Requires a volume scan Combined Shears The RMS value of the radial azimuth and or elevation shear This is sometimes referred to as the total shear 7 In VVP select the name of a VVP produ...

Страница 182: ...ter Bin Removal Point clutter bins produce erroneous high shear values when they are differenced with surrounding valid velocities The first step in the shear algorithm is to remove obvious clutter bi...

Страница 183: ...erval to the nearest bin that is less than or equal to half of the difference interval Smooth the Differences Differencing is inherently noisy The next step is to smooth the computed differences This...

Страница 184: ...sum of the squares of the 2 shear values radial and azimuth associated with each bin If only a single shear is selected radial or azimuth this step is skipped Convert to Cartesian and Optional Final C...

Страница 185: ...sin sin v cos sin where the first term is the apparent azimuth shear caused by the mean wind Thus when the azimuth derivative is computed the correction term is applied as follows VR uosin sin vocos...

Страница 186: ...ched or the automatic mode switching feature can be used For example the surveillance mode could consist of a 15 elevation volume scan sequence The WARN product can be keyed on a severe storm indicato...

Страница 187: ...or shear detection while the upper angle can serve as the basis for an additional reflectivity aloft criterion for the WARN product Sector scan mode is used to limit the data coverage to the terminal...

Страница 188: ...so that personnel can view the situation display a Make the automatic output request so that the shear product is sent every time that it is made b Make sure a workstation is running the IRIS menus s...

Страница 189: ...SHEAR Product Configuration menu from 1 to 2 km 0 6 to 1 2 mi Increase the SHEAR magnitude threshold in the WARN Product Configuration menu Increase the threshold AREA size in the WARN Product Configu...

Страница 190: ...sudden wind shifts occur when a frontal boundary passes The following figure shows an example of a typical shear line The most severe wind shifts are associated with mesoscale gust fronts which occur...

Страница 191: ...phenomena so angles of 1 or less are typically used to detect these You may select 1 or 2 angles If you select 2 angles make sure both are above the threshold to be included in the shear line 5 Defin...

Страница 192: ...s Count and Time Enter the number of forecast points and the time interval between each forecast point and select Ok The time you specify is inserted in the field Max Time Step The forecast of shear l...

Страница 193: ...t generator to audibly signals the warning message in addition to displaying it as a message You must also select Setup Enable Speech in IRIS 11 To troubleshoot or test SLINE products enable a thresho...

Страница 194: ...tect a linear region Points that fall outside the curve are eliminated and the curve is refit Only one shear line can be considered in a product 5 The speed of motion normal to the gust front is obtai...

Страница 195: ...ge area are shown In the IRIS station plot format the plot is standardized although different reporting stations vary in measuring capabilities as well as in data the span and resolution Individual nu...

Страница 196: ...to half a meter second so 20 knots would be 10 m s The line points up wind It has a half feather line for 5 knots and full length lines for 10 knots and a triangular flag for 50 knots If the wind spe...

Страница 197: ...esent Weather FU VA HZ DU SA BLSA VCBLSA BLDU VCBLDU BLPY PO VCPO VCSS VCDS FC FC SQ TS VCSH VIRGA VCTS MIFG BR SS DRSA DS DRDU VCFG BCFG PRFG FG FZFG DZ RA DZ RA DZ RA DZ RA DZ RA DZ RA DZ RA FZDZ FZ...

Страница 198: ...the station in this case 3 40 The second level of clouds is drawn above the station which is 6 60 in the example There can be a third level drawn above the second not shown in this example The first n...

Страница 199: ...mple 4 means that the pressure went up by 0 4 millibars in the last 3 hours METAR reports do not contain pressure trend so this is blank The following figure shows the available symbols Figure 72 SWS...

Страница 200: ...S product in the Quick Look Window you can hover over a station and right click the mouse to show a report of the raw METAR or SYNOP reports for that station If there are more than one report in the p...

Страница 201: ...hen runs an input pipe to convert this data to IRIS s internal SWS format and insert into the IRIS product directory You must configure the SWS input 1 Make sure you use a recent version of the metar2...

Страница 202: ...t but missing from the file is deleted and a message is placed in the pipe log file You must maintain the files to remove old stations and add new ones For a rough list of METAR and SYNOP stations see...

Страница 203: ...METAR and WMO File Format Examples METAR ASCII file format including a WMO GTS header line and then each station s report Each report has a separate time stamp signs are optional SATU20 LTAA 160150 ME...

Страница 204: ...hen possible Vaisala recommends viewing radar data with IRIS Focus The Quick Look Window QLW displays IRIS Analysis products Figure 75 Example QLW PPI Reflectivity 480 x 480 window size with range rin...

Страница 205: ...he status of automatically assigned images in the QLW Legend The legend provides tools for selecting radar sites products and times and displaying this information You can also loop animations or brow...

Страница 206: ...f the images displayed in the QLW This allows you to see even from a distance that a window is set to display live data The update indicator is next to the tool area OPT button Window Modes The Quick...

Страница 207: ...activity Legend ON OFF Button Legend ON OFF Button The legend area title bar and scroll bars may by toggled off by the Legend icon which is located on the left side of the tool section Right click the...

Страница 208: ...t in general the window password configured in Setup General is not the same as the UNIX operator password When you are done select File and set the privilege back to Observer 6 4 Viewing Products in...

Страница 209: ...st If the list shows N A no products are available on the disk for the radar site you have selected b To display other products select PPI to see all the available product types and then select the pr...

Страница 210: ...settings on the fly such as the cross section line position or CAPPI height and see continuous live updates on the display typically at more than 10 frames per second For example the VIL layer top ca...

Страница 211: ...m Level 1 On the top of the Quick Look Window select View 2 To change the zoom select a zoom level and use the scroll bars to position your display in the area of interest When you zoom IRIS tries to...

Страница 212: ...the legend information is included in the image itself selectable as an output option in the QLW or in the Product Output Menu in the case of automatic outputs to a window Try square images and use t...

Страница 213: ...se the Data Type for which you want to define a color scale Display Units shows the units of measurement for the data type that is currently selected When you first enter the Color Scale Tool the data...

Страница 214: ...r the simplest mergings of echo classes of HydroClass 4 If you are in uniform mode a Select a Color Set Up to 4 named color sets are available The color sets are defined by the system operator in the...

Страница 215: ...at interval using the color scroll bars Those data values on the display are shown in the new color 6 8 Display Options Tool IRIS Product Output The Display Options tool allows you to select display c...

Страница 216: ...current settings FOR THIS WINDOW ONLY When you save a configuration you are not affecting any other window any other user or the operation of IRIS This means that with the permission of your system ma...

Страница 217: ...d shown above to for example PPI the changes are not applied are in the displayed product the CAPPI until you select Apply All Adding Product Overlays The Display Option Tool Product Overlay section l...

Страница 218: ...lect contrasting color scales to be able to separate the data In this example a gray scale was used for the TOPS The drop shadows on the VIL are helpful If your IRIS system supports satellite IMAGE pr...

Страница 219: ...r nautical miles The Center button allows you to select the center of the range rings from a list of pre defined home points The home points are defined in the Cursor or Track tool You must have opera...

Страница 220: ...s on the screen Overlay Layers Geographic overlays show coastlines roads political boundaries and similar See Overlay utility in IRIS and RDA Utilities Guide Select Overlay Layers to expand the Displa...

Страница 221: ...make changes to the Display Options the Apply Other Products applies the changes Any changes that are applied affect only the window that you are in You do not have to worry about affecting other win...

Страница 222: ...Overlay Tool The Product Overlay tool allows you to overlay multiple products warning centroids and echo tracks or adjust the product overlay opacity IRIS Product and Display User Guide M211319EN H 22...

Страница 223: ...Figure 80 Product Overlay Tool 1 Select the icon to show the Product Overlay tool 2 Select the product type and product name Chapter 6 Quick Look Window RESTRICTED 221...

Страница 224: ...6 11 Animation Tool Figure 81 Quick Look Window Animation Tool IRIS Product and Display User Guide M211319EN H 222 RESTRICTED...

Страница 225: ...place the cursor in the image area of the loop When a loop starts the Site filter automatically matches the loop so that only images from the site for which the loop was started are displayed Loop Lo...

Страница 226: ...your changes If your loop must be flushed and reloaded or your loop buffer becomes corrupted use the Flush button to refresh the buffer The loop reloads the next time it starts Previous Next Single s...

Страница 227: ...e speed of your CPU the amount of memory that you have and the size of image that you are looping Pause This is the pause in seconds between successive loops In addition to marking the end of a loop P...

Страница 228: ...o create loops that do not end with the most recent image for example for analysis of archive data from last year Current Frame mode sets the loop end time to be the time of the image that is currentl...

Страница 229: ...example in the following figure different 4 slides of different products are shown in the Quick Look Window QLW for 10 seconds You can configure multiple windows so that images in different windows ch...

Страница 230: ...t can be displayed alongside a CAPPI product from the previous hour To make a single step time sequence type the same product type the name for each slide and specify 0 1 2 for the lags c Specify the...

Страница 231: ...latitude and longitude of the position to the nearest tenth of a minute Select U to toggle the units between decimal degrees and decimal minutes Height Shows the height above the curved surface of the...

Страница 232: ...sea level at the location of the cursor To use Ground Height you must add Digital Elevation Model DEM data in GeoTiff format in the usr sigmet dt directory with the filename dem tif The DEM data shou...

Страница 233: ...nts for key locations 1 Select In the Set Plant do one of the following Enter the LAT LON of the home point and the name of the home point You can type the LAT LON using either degrees and minutes or...

Страница 234: ...notation text in various font sizes and colors Add bitmap icons Determine the center of a typhoon spiral The left side of the menu contains the control of the next the cursor action and selection of t...

Страница 235: ...he highlight color to distinguish it from the track line Icon in this case is an airport symbol Annotation examples are the text Icon Target and Forecast Line Target for the forecast is indicated by t...

Страница 236: ...the closest approach of the track to the target Time at The clock time of when the echo makes its closest approach Approach The distance of closest approach as measured from the track line to the targ...

Страница 237: ...me select the button next to the name field and select from the list of pre defined names There is always a track with the name MAN_DEFAULT To create a new name replace the text in the name field IRIS...

Страница 238: ...the latitude and longitude of the last track point that is the most recent data time Select U to toggle the units between decimal degrees and decimal minutes Speed and Direction Shows the speed and di...

Страница 239: ...ding the track points skip a few images You do not need a point for every image In track mode use the mouse to add track points and the left right arrow keys for browsing 5 To delete a track point a S...

Страница 240: ...emoved 3 To create your own icons use a program such as Paint on a PC or Kiconedit on a Linux system Icons are xbm format bit mapped icons which are stored in the usr sigmet config overlay directory T...

Страница 241: ...ints are indicated by the with the time displayed beneath each one Note that the latest track point at 1048 is highlighted since this corresponds to the frame that is currently displayed Forecast Line...

Страница 242: ...yed out If you move the spiral location the status displays Repositioning Spiral This remains until you push the button In this case it displays Fitting winds and finally Success It can take up to a m...

Страница 243: ...W using the Rotate option b Set the minimum and maximum displayed range of the spiral using the Range type in fields 6 15 Forecast Tool Use the Forecast Tool to shift products into the future to see t...

Страница 244: ...her by IRIS or by external programs that create forecast products and insert them into IRIS The echoes can be subjected to both a non uniform motion field and a non uniform intensity change field The...

Страница 245: ...we want to forecast 2 The forecast product motion vectors and intensity change array points are re mapped onto the output array This re mapping means that the input product and the forecast product d...

Страница 246: ...this case the cross section is viewed from the east through the eye of the typhoon The XSECT tool shown on the right allows you to configure nearly all aspects of the cross section Cross Section Displ...

Страница 247: ...ention Figure 89 Cross Section Range Scale Cross Section Display in Standard Window To display cross sections in a standard window select an XSECT product The cross sections inherit the name of your w...

Страница 248: ...input data type the right variable represents what is displayed The following example shows a polarization diversity example c In Size select a large or a small size window A small size is usually be...

Страница 249: ...oduct Output Options Tool There are several products for which you can specify additional output options If one of these products is on the screen the Output Options tool icon is enabled The Output Op...

Страница 250: ...Constant Altitude Plan Position Indicator page 36 NDOP Output Options page 249 6 17 2 THICK Output Options Figure 90 THICK Output Tool The THICK product shows the difference in height of the lowest an...

Страница 251: ...e it on the screen More information NDOP Multiple Doppler page 167 CAPPI Height Selection Tool page 248 WIND and FCAST Output Options page 257 6 17 4 VAD Output Options During display you can select o...

Страница 252: ...st of a plot of velocity for all azimuths You can choose to display just one plot of one height or many plots showing all the heights Height If you have selected 1 height use this slide bar or the cur...

Страница 253: ...ivergence The Output Options menu lets you choose to display wind data in one of the following ways Choose Display_Style Graphs to display a graph of VVP parameters against height at a single time You...

Страница 254: ...deformation which indicates the strength of the stretching You can set the maximum length of the dilatation using the Display Style Graphs Scale Limit for deformation Select None if you do not want t...

Страница 255: ...Typically a value of 80 is used 10 To test your setting select Apply The velocity point is displayed if the following is true Stan dardDeviation In t res old 100 1 0 Velocity 10 0 More information Pr...

Страница 256: ...how the Display Options menu Make sure the Product Type is VVP 3 Select Options to show the VVP Output Options menu Either the Graphs or the Time Height submenu is shown 4 If Time Height is shown sele...

Страница 257: ...n you want to plot Axis of Dilation Select to chart the axis of dilatation You cannot edit the Scale Limits column for this field Reflectivity Select to chart the reflectivity Type a value to specify...

Страница 258: ...e No additional label Maximum The centroid is labeled with the maximum value of the data throughout the centroid Average The centroid is labeled with the average value of the data throughout the centr...

Страница 259: ...elect a product to overlay Select File Save to save the Warn Tool options 6 17 8 WIND and FCAST Output Options 1 Make sure WIND or FCAST is the current product type 2 Select Options The Wind Output Op...

Страница 260: ...ots and triangles for 50 knots Wind strings point away from the wind direction with the length of the string indicating the relative wind speed the longer the string the higher the speed String Max Le...

Страница 261: ...up Output 2 To print a display select File Print More information Sending a Product to a Device page 266 6 19 QLW Keyboard Commands To use the keyboard commands place your cursor in the image area of...

Страница 262: ...an route output to many devices Printer Postscript printers configured on you system Window A color window on the local workstation The display is generated by the IRIS host This window can be exporte...

Страница 263: ...put Filters page 261 Product List Displays the list of products that you have selected See Product Output Product List page 264 1 Choose Menus Product Output from the IRIS menu bar or from any of the...

Страница 264: ...characters TASK Enter the name of a task to filter for products generated by a specific task You can include wildcard characters in the task name For example entering a product name of PPI _ selects...

Страница 265: ...Display Options Select the this icon to specify the output options to be used when your product is sent to a display device Color Scale Configurations Select this icon to specify the color options to...

Страница 266: ...7 3 2 Product Output Product List The product list at the bottom of the Product Output menu lists each product name on a header line followed by the versions of the product that are currently on disk...

Страница 267: ...PPI Data Parameter Elevation Max Range RAIN1 Input Product Minutes avg Max Range RAINN Hours Max Range RAW Data Parameters All One Max Range RHI Data Parameter Azimuth Max Range RTI Data Parameter St...

Страница 268: ...d time local time when the product data was collected Request Use the Request field to request product output Position the mouse cursor over an entry in the product list and select Send The menu shown...

Страница 269: ...cators Sending The output formatter is working on your request Done The product has been sent to the selected network device There is currently no request Error An error occurred Check the Radar Statu...

Страница 270: ...ts the Watchdog from deleting a file This is useful if you have files that you want to save for several days Note that the best way to make a record of a file is to send it to tape Delete Signals the...

Страница 271: ...ou want is at the end Optical disk drives Optical disks such as re writable magneto optical drives are more expensive than tape but last longer and are much more convenient to use because of their ran...

Страница 272: ...6 10 13 12 Jul 1997 1 HAI RAW AERIAL Z V W 240km One AERIAL 16 05 00 12 Jul 1997 36 36 Files 9 7M 9 7M Bytes Figure 95 Archive Menu Filter Menu You can use the standard filter menu for selecting the p...

Страница 273: ...Retrieve a product file from the archive and copy it to disk Inventory the product files on the archive Status Status shows the current status of the archive drive and should correspond to the comman...

Страница 274: ...S has encountered the end of tape Usually IRIS rewinds the tape automatically so the message is replaced by Rewind Up to 3 status indicators can appear together in the Status field For example if a Re...

Страница 275: ...e Enter the name of a product to narrow the list down to products having that name You can include wildcard characters in the product name A question mark matches any single character an asterisk matc...

Страница 276: ...logical order 8 2 2 Archive Log Area File Site Type Task Time Product Date Product Specific Parameters d 1 HAI CAPPI Z_020_240 Z 2 0km 240km 480 P PPIVOL 17 11 13 12 Jul 1997 d 1 HAI PPI Z_020_240 Z 2...

Страница 277: ...agged for a retrieve operation d The file is on disk as well as on tape Retrieve is not permitted blank The file is on tape only and has not been tagged for retrieve Right click File to select one of...

Страница 278: ...stroying valuable data or software backup or delivery tapes Only operators are permitted to use the tape initialization utility CAUTION Do not initialize an existing tape or disk if you want to record...

Страница 279: ...e command At the end of the initialization IRIS displays a unique tape number that is used in the future to refer to the disk inventories maintained for the tape Write the name of the medium that IRIS...

Страница 280: ...e left mounted so that new files can be automatically written to the archive without having to enter the Archive menu This continues until the medium is full Retrieve Unmount and Inventory commands ca...

Страница 281: ...The time depends on the size of your IRIS system disk but is typically several hours 8 To stop recording manually select Commands Stop IRIS waits for the next command which could be to resume the rec...

Страница 282: ...03_08_S9C LIS The archive ID SIG_88_03_08_S9C is an example 8 7 Retrieving Product Files from an Archive You can use the Archive menu to retrieve product files from tape and put them back on disk wher...

Страница 283: ...st of the files that you want to retrieve 6 Select Retrieve from one of the following menus If you selected the entries with the mouse position the mouse cursor over the tape log and right click the m...

Страница 284: ...Inventory command is reissued the inventory is started from the beginning of the tape During Mount Stop cancels the Mount operation and rewinds the tape During Unmount Stop has no effect 8 9 Unmountin...

Страница 285: ...t files are cataloged by their associated tasks and stored on disk in an ingest summary file IRIS uses an automatic Watchdog process to delete old ingest files The Ingest Summary menu provides a list...

Страница 286: ...Start Time Shows the time that the task started to collect data Size Shows the total amount of disk space occupied by the ingest files for this run of the task 2 Select an entry in the list and positi...

Страница 287: ...select from a list of values Files Control how many files to include in the list Apply Select Apply to update the product list based on your selection criteria Grab If you have selected a product sele...

Страница 288: ...more than one entry in the list Click and drag the mouse to select a group of entries in the list or press CTRL then click and drag the mouse to select multiple groups of entries Use the Filter menu...

Страница 289: ...ays that appear different based on which layers are active Layers can be drawn in different colors Underlays are filled regions of color displayed under the radar images where there is no weather data...

Страница 290: ...ve your cursor around your map with the mouse To find a precise point use the arrow buttons of the keyboard to move pixel by pixel 4 To define the mode to show latitude and longitude select File Lat L...

Страница 291: ...te subareas Layers to draw Defines if you want to work with all of your map layers or only a subset b In the bottom pane define the following Fill points Indicate the areas typically lakes you want to...

Страница 292: ...ct the map projection Typically Azimuthal is used in one radar applications Mercator in composites in the tropical areas and Polar Stereographic in the composites near the poles IRIS Product and Displ...

Страница 293: ...oints You can also select a pointer which gives you position of you cursor a Assign each layer a color from a predefined set shown in a box next to the layer name To define more colors use the Color u...

Страница 294: ...To add icons you must include a text next to the icon IRIS Product and Display User Guide M211319EN H 292 RESTRICTED...

Страница 295: ...underlay can contain up to 400 fill points Overlay starts from each of the specified fill points and fills all contiguous areas stopping at overlay lines You can enter many fill points for the same fi...

Страница 296: ...nts are defined in terms of map units Map units are any arbitrary unit of measure that is E W and N S of an origin 0 0 which can be anywhere on the map Often millimeters from graph paper are used to d...

Страница 297: ...A list of available overlays is shown The following figure shows an example with 2 overlays for the HEL site HELSINKI and KARTTA Overlay XXX KING SIG SIGMET HUN HUNTSVI LLE HEL HELSINK I WND SIGMET Si...

Страница 298: ...e a low elevation and measure in all azimuths then increase the elevation a little and measure in all azimuths again and so on so we get data from all directions at different ranges This pack of data...

Страница 299: ...ts_Re ceived Distan ce_Squared Attenuation Hardware_Constan t Rain_or_Snow_Constan t For cloud physics Z is a sum NiDi 6 where Ni is the number of particles with diameter Di per unit volume in the atm...

Страница 300: ...m 0 08 in Z is same R is not A good first guess is the classical Marshall Palmer equation Z 200R1 6 which equals to R Z 200 0 625 A 3 Geometry The Earth is spherical Microwaves do not follow the surfa...

Страница 301: ...ocking buildings near the antenna can partially or totally shade echoes from a certain direction Attenuation in rain echoes behind heavy rain can disappear especially if the wavelength is small Attenu...

Страница 302: ...ts many samples must be processed together 64 is good This sets limits to antenna speed The maximum speed which can be measured unambiguously is Vmax PRF 4 where lambda denotes wavelength A 6 Clutter...

Страница 303: ...Figure 103 Typical Spectrum Plot Appendix A Basic Radar Meteorology RESTRICTED 301...

Страница 304: ...on Parameters and Coordinate Transformations For systems with the Vaisala RCP8 see the theoretical derivation of the stabilization in Radar Control Processor RCP8 User Guide Table 24 Basic Variables o...

Страница 305: ...elevation of the antenna as follows x sin AZ cos EL cos AZ cos EL sin EL AZand EL are eart relative These are known from the antenna controller Thus the problem is to determine the yA the velocity of...

Страница 306: ...rdinates The position vector of the antenna in earth coordinates can be expressed as INU Case yA y1 yA y1 Gyro Case yA yS yA yS so that INU Case yA y1 yAI Gyro Case yA y1 yAS where yAI yA yI and yAS y...

Страница 307: ...the reference point to the antenna The translational motion of the reference point is As sensed by the INU for the INU Case y I u v w As sensed by the GPS for the Gyro Case y S u v w As a special cas...

Страница 308: ...es defined for ships have the reversed sign Note that since no other interpretation of the roll and pitch is done this can otherwise be ignored The antenna vector relative to the aircraft is as follow...

Страница 309: ...ation information that is reported back from the antenna controller as well as the velocity of the antenna yA and the velocity correction Use the Antenna utility should to verify the following The sig...

Страница 310: ...xtracting them from the ship s drawing can be difficult The athwartship component of the moment arm is usually the easiest measure and in most cases the antenna is centered across the ship This leaves...

Страница 311: ...g measured CW from true north HEAD 2 Rate of change of heading P Pitch measured relative to horizon for bow down P P Rate of change of pitch RR Roll measured relative to the horizon for port side down...

Страница 312: ...onal detail layers such as radar range rings latitude longitude grid and landmark labels to the view for easy navigation You can also store preferred view angles and display states for later use You c...

Страница 313: ...ver computer running IRIS Analysis software generating many 2D radar products These products may be viewed directly on this central server computer or re distributed to other client computers running...

Страница 314: ...ar Site IRIS Radar Radar Site IRIS 3DView 3D PRODUCTS IRIS Display any location IRIS Display any location Figure 106 IRIS 3DView Data Flow C 1 2 IRIS 3DView System Requirements IRIS 3DView requires a...

Страница 315: ...i686 rpm compat expat1 1 95 8 8 el6 i686 rpm expat 2 0 1 9 1 el6 i686 rpm expat devel 2 0 1 9 1 el6 i686 rpm xorg x11 apps 7 4 10 el6 i686 rpm xorg x11 server common 1 7 7 29 el6 i686 rpm xorg x11 ser...

Страница 316: ...lors conf IRIS3DLandmarks conf IRIS3DVisStyles conf 7 Do one of the following a If you have the IRIS software installed create the following directories usr iris_data data geo for geo data usr iris_da...

Страница 317: ...icense dialog box displays the Sitename for your system In that case leave it unchanged If not enter a unique Sitename 16 characters or less and select Next The IRIS 3D View License dialog displays th...

Страница 318: ...e setup icon in the upper right hand corner to open the Settings Window dialog box Configure the data directory to point to the directories created earlier according to your data type IRIS Product and...

Страница 319: ...iles to the config directory of the iris3d user a Set permissions for everybody to be able to read and write by running chmod R 777 home iris3d as root user b From the visualization window select File...

Страница 320: ...d for the password Stop and start the daemon by typing the following sbin service iris3dviewd stop sbin service iris3dviewd start 15 Test background processing a Copy 3D data to the 3D directory that...

Страница 321: ...session type iris3dview The software starts and the main window is shown with controls for the view on the left The starting view is a direct downward view The volume outline guide dark lines are dra...

Страница 322: ...the 3D data selector where you can select the data file 3 To open the file in Live mode select Display mode Live In Live mode IRIS 3DView opens the latest data file from the radar site selected in the...

Страница 323: ...face becomes and it is easier to see through it Figure 108 Example of Surface Rendering C 5 2 Volume Rendering In volume rendering mode IRIS 3DView renders a 3D visualization of the data that is betwe...

Страница 324: ...Figure 109 Example of Volume Rendering IRIS Product and Display User Guide M211319EN H 322 RESTRICTED...

Страница 325: ...on the left of the main window to define what is shown in the 3D view Drag the handle on the right side of the control area to expand the control area Toggle the eye icons to manage the visibility of...

Страница 326: ...outline guide on or off the dark lines around the rendered area and select the 3D and or 2D radar products that are rendered 4 In GEO Layers select which if the following geographical information lay...

Страница 327: ...t Tool 1 Select File The export tool window opens with the currently rendered 3D view shown with a reflectivity legend 2 To save the current image as a file select Save as image Appendix C IRIS 3DView...

Страница 328: ...the Display state used in background rendering b Create and save a preset for the desired View angle c Select Copy settings to background to make the presets available for selection d Set the desired...

Страница 329: ...C 8 Using the Product Information Tool Figure 113 Product Information Tool Appendix C IRIS 3DView RESTRICTED 327...

Страница 330: ...sosurfaces 1 4 Threshold value for each isosurface Opacity of each isosurface Color of each isosurface 3 If you have selected volume rendering as the rendering mode you can define the following Volume...

Страница 331: ...cursor tool window is updated with the location and value information at the cursor position To move the cursor only on horizontal or vertical axis hold down the shift key when moving the cursor You...

Страница 332: ...otal number of frames created from the data file The number of frames is affected by the amount of data in the file and the animation settings that are active on the toolbar such as Time span and Fram...

Страница 333: ...pan The options are 5 15 30 or 60 minutes Animation Speed Sets an additional delay between displayed frames Does not affect the rendering time Options are Fastest no delay 1 second 3 seconds 5 seconds...

Страница 334: ...tings Figure 116 IRIS 3DView Settings Window 1 In the top menu bar select settings The Settings window opens containing general settings for the IRIS 3DView software IRIS Product and Display User Guid...

Страница 335: ...ion will speed up the generation of the 3D model but will produce a less detailed rendering Options for horizontal resolution Full Half 1 3x 1 4x Options for vertical resolution Full Half Data Smoothi...

Страница 336: ...to generate TDWR products for output to standard US FAA style ribbon displays Note that an LLWAS system is not required See TDWR LLWAS Integrator and Runways Utility page 353 Runway Utility Graphical...

Страница 337: ...evel Wind Shear Alert System LLWAS Based on anemometers that are positioned around the air terminal LLWAS is not available at all sites Where it is available it provides backup to the TDWR in cases wh...

Страница 338: ...IRIS Display Radar Data Acquisition Figure 117 IRIS TDWR Hardware Configuration Example With the IRIS architecture the RPG and MDT functions could be combined into the RDA workstation Reducing the amo...

Страница 339: ...ecial TDWR product Data Flow to Generate Ribbon Display IRIS Analysis on RPG Product Configuration Files SLINE Config SHEAR Config WARN Config Product Process Ingest Files of Base Data Product Files T...

Страница 340: ...e ribsetup to configure this D 5 IRIS TDWR Configuration Summary You must install and configure the TDWR components by performing the following procedures 1 Configure IRIS for TDWR operation a Configu...

Страница 341: ...gle runway use a dash as in the example that is 33 Note if the left and right runways are within approximately 500 m 1640 ft 5 in of each other it is easier to designate a single corridor for alert pu...

Страница 342: ...ts of the user and the constraints of the site For example some customers may require that a complete volume scan information be collected during TDWR operation to provide general weather monitoring w...

Страница 343: ...is for a network output to a workstation called SD1 The standard IRIS target directory and TCPIP notification port are used in the example b Configure the IRIS Product Output Menu to make automatic ou...

Страница 344: ...for the Integrator in the runways conf file See Configuring Integrator and Runways Utility runways conf page 354 The recommended port is 30726 as shown in the example b Configure the IRIS Product Out...

Страница 345: ...ind shear alert shear line for runway 33L approach and departure with an expected 25 knot gain The threshold winds are displayed at the end of each line In addition to the text messages an audio alert...

Страница 346: ...gnments J2 J1 Signal 1 1 GND shield 3 2 Receive Data 2 3 Transmit Data 7 7 GND D 7 3 Dale Ribbon Display General Use Ribbon Display Front Panel Controls ACKNOWLEDGE SELF TEST BRIGHTNESS ALARM VOLUME N...

Страница 347: ...nable communication between the monitor host and other peripherals Put the switch in the BYPASS position to route the RS 232D signals are routed around the monitor This hardware switch isolates the mo...

Страница 348: ...can access the vribbon The vribbon display is run locally on an SD by opening a terminal and typing vribbon Figure 122 vribbon Display The display has 10 lines The top nine lines are used to display...

Страница 349: ...ur protected areas the ribsetup utility is used to define the appearance of the ribbon display that is what runway information is displayed on each line of each ribbon display To start the ribsetup ut...

Страница 350: ...r than 8 displays The second row shows the names that have been configured for the displays The last four names are set to none to indicate that these are unused The status of each ribbon display is i...

Страница 351: ...The button turns yellow to indicate which set is being viewed edited In the example the setup menu is set to view RWY 15 yellow button The top of the setup menu shows the display number and is color...

Страница 352: ...corridors as shown below The corridor names are taken from the IRIS setup product warning areas that were created see the beginning of this section In addition there is a blank line to configure blank...

Страница 353: ...ile Print to document your settings Then you can click on a different set yellow button under the set name and configure the displays for this Continue until you have configured all of the active sets...

Страница 354: ...r 1 15 D MBA Enter Alert type for Corridor 2 33 A Enter Alert type for Corridor 3 33 D Sending product to IRIS Enter Corridor Count 4 tdwr_sim sends a simulated TDWR product to IRIS which is transmitt...

Страница 355: ...ted on the ribbon display since an aircraft would encounter this first In the event of failure of a system the failed system uses the alerts from the other system for example if TDWR fails then only L...

Страница 356: ...ocket Port 30725 Output Receiver Socket Port 30726 SLINE WARN on SHEAR LLWAS Receiver usr iris_data tdwr Socket Port 30727 TDWR LLWAS Integrator Runways Utility LLWAS Data optional Figure 125 IRIS Int...

Страница 357: ...mkdir tdwr Set the privileges for the directory to match the other directories do an ls ll to see how the other directories are set For a standard installation type chown operator tdwr chgrp users td...

Страница 358: ...er input data stale IRIS_IN 30726 IRIS_IN_DIR usr iris_data tdwr IRIS_IN_TIME 120 Define output related info Socket host and port Directory Timeout to retransmit output even with no changes IRIS_OUT c...

Страница 359: ...then specified in the next two fields for example 36L and 18R The last field is the default active runway when the software is first started This can be either of the runway names or if available LLW...

Страница 360: ...See Configuring IRIS Product Outputs for TDWR page 340 IRIS_OUT cyclone 30725 IRIS_OUT_DIR usr iris_data product These entries configure the characteristics of the output from the Integrator to IRIS...

Страница 361: ...on If you have an LLWAS system you must specify the LAT LON of the radar and the sitename since these are not in the LLWAS header This information is needed if the radar fails and the alerts are based...

Страница 362: ...t be run on the same IRIS node where the Integrator is run typically this is the IRIS workstation assigned to generate products however you can export the runways display to another workstation on the...

Страница 363: ...ys Utility To exit the runways utility select File Exit in the upper left Note that the settings specified in the runways utility are used by the Integrator after you exit Setting Active Inactive Runw...

Страница 364: ...communication status with the integrator is displayed in the LLWAS column The image above shows the display DEAD in red background to indicate the LLWAS is not communicating to the Integrator IRIS Pro...

Страница 365: ...k Look Window you can right click the mouse on a region or icon to see a bar graph representation of the subcatchment amounts by hour RAIN1 Hourly rainfall accumulation for selectable Z R relationship...

Страница 366: ...1 Algorithm From external raingage network Corrected RAIN1 Product Format Conversion for Hourly Gage Totals IRIS Product Generator IRIS Product Generator RAINN CATCH Algorithms CATCH Product RAINN Pro...

Страница 367: ...led pseudo CAPPI is used so that at far ranges the lowest elevation angle is used to fill in the data RAIN1 Processing and Raingage Calibration Process Gage correction is activated when the gage corre...

Страница 368: ...rminated by a newline character Each file represents data from any number of stations but only one data time is reported in each file That time is the ending time of the data and is reported using the...

Страница 369: ...capable of calculating a Z R relationship The numbers are the constant and exponent in the equation Z CRE When there is no rain or the disdrometer is unable to make a measurement the values of 0 0 are...

Страница 370: ...6 mi For example for a 240 maximum range a 480 480 product would have 1 km 0 6 mi resolution CAPPI height of approximately 1 km 0 6 mi Fill set to Yes Pseudo CAPPI Select a single level CAPPI height...

Страница 371: ...imum amount of rainfall hourly accumulation for a gage to be considered as having a valid amount of rainfall This depends to some extent on the accuracy of the gages A value of 3 mm 0 12 in would be t...

Страница 372: ...aging Distance to 1 5 km 0 9 mi would result in averaging over 3 3 pixels centered about the pixel containing the gage The following figure shows some examples Radar Data Averaging about a Raingage Lo...

Страница 373: ...tor for a gage The RAIN1 product is then corrected by interpolating the correction factors for all of the gages to each pixel in the RAIN1 product and multiplying the radar pixel value by the correcti...

Страница 374: ...oduct generator must await the arrival of both the CAPPIs and the GAGE product for the previous hour To account for the delay in the arrival of the GAGE product a Gage Wait Time is defined in IRIS Set...

Страница 375: ...PPI plus the Tail and WaitG times The Tail time is difference between the data time of the last input and the next integer hour The WaitG time is the Raingage Arrival Wait Time from Setup Product Note...

Страница 376: ...e no RAIN1 product is generated More information GAGE Raingage Reports page 165 Scheduling RAIN1 Products page 57 E 7 Hydromet Raingage References Brandes E A and J W Wilson 1982 Thunderstorms A socia...

Страница 377: ...LOG value to improve measurement sensitivity 4 The tasks use Doppler filter number 4 which is a Gaussian adaptive GMAP filter with a 0 4 m s width Depending on the clutter conditions test a weaker fi...

Страница 378: ...in of noise uncertainty even in conditions of extreme rain In cooler climates with a calibrated radar the LOG threshold can be as low as 1 2 dB The following figure shows the task configuration detail...

Страница 379: ...on of non meteorological echo The Z data presents the true fields of precipitation The combined observations of KDP and Z are used in quantitative rainfall estimates In difficult conditions with movin...

Страница 380: ...igh quality radial winds in the range of 16 m s Due to a high pulse repetition frequency high elevations and the modest ranges in use narrow precipitation spectra are possible The quality of standard...

Страница 381: ...Figure 129 VOL_B task configuration dual polarization Polarization Horiz DP Attn Cor Z ZDR disabled Proc mode FFT Measured data moments T Z Vel Width SQI F 1 4 WIND The WIND task is a short distance...

Страница 382: ...ng higher dual PRF ratios as well as longer ranges decreases the quality of velocity data Figure 130 WIND task configuration F 1 5 SUNCAL and ZDRCAL tasks Detailed configurations of the SUNCAL and ZDR...

Страница 383: ...s The radar system produces RAW products on the radar server computer and sends them to the central site for product generation To reduce communication bandwidth by default data is truncated to1 byte...

Страница 384: ...products In dual polarization systems a melting height product VOL is configured and scheduled by default This product uses tasks VOL_A and VOL_B to compute the height of the melting layer Figure 132...

Страница 385: ...r reflectivity surveillance VOL_A and VOL_B Reflectivity related end user products such as rain or storm detection or hydrological measurements 1 WIND Wind related products For example V VVP WIND and...

Страница 386: ......

Страница 387: ...versions 11 Doppler wind measurements 300 DWELL 13 139 examples 140 examples migratory bird 157 optimize 153 scan task 153 scheduling 143 target detection 155 157 target detection algorithm 151 E expo...

Страница 388: ...output options FCAST 257 NDOP 249 THICK 248 VAD 249 WARN 256 WIND 257 overlay 220 287 radar site 295 overlay header 294 P performance optimize 120 PPI 13 55 print display 258 automatic 266 product con...

Страница 389: ...eferences hydromet raingage correction 374 SRI 82 reflectivity 297 retrieve 269 retrieved data 120 RHI 13 64 67 cumulonimbus example 66 RTI 13 68 S schedule CATCH 124 RAIN1 57 RAIN N 60 SHEAR 13 36 64...

Страница 390: ...ok Window 234 TRACK 13 88 U unmount tape disk 282 V VAD 13 92 output options 249 VIL 13 93 volume scan 17 VVP 13 96 line graphs 253 product output 99 time height 251 W WARN 13 99 104 composite algorit...

Страница 391: ...e warranty for each product Technical support Contact Vaisala technical support at helpdesk vaisala com Provide at least the following supporting information as applicable Product name model and seria...

Страница 392: ......

Страница 393: ......

Страница 394: ...www vaisala com...

Отзывы: