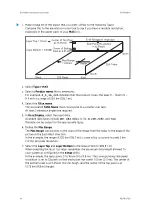
1. Make a diagram of the layout that you want, similar to the following figure.
Compare this to the elevations in your task to see if you have a sensible resolution,
especially in the upper parts of your
MAX
box.
Layer Top = 16 km
Layer Bottom = 0 km
Center of Top Pixel
at 15.75 km
Center of Bottom
Pixel at 0.25 km
E–W Maximum Projection
Radar
West
220 Pixels
East
South
224 Pixels
North
Max Range
= 220 km
Side Panel Resolution
= 32 Pixels
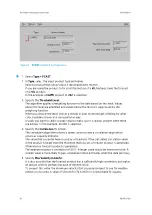
2. Select
Type > MAX
.
3. Select a
Product Name
that is mnemonic.
For example,
Z_0_16_220
indicates that the product covers the layer 0 ... 16 km (0 ...
9.9 mi) to a range of 220 km (136.7 mi).
4. Select the
TASK Name
.
The associated
TASK Name
must correspond to a volume scan task.
At least 2 elevation angles are required.
5. In
Data:Display
, select the input data.
Available data types include
dBT
,
dBZ
,
dBZc
,
V
,
Vc
,
W
,
ZDR
,
ZDRc
, and
Kdp
.
Rainrate can be output for the appropriate types.
6. Define the
Max Range
.
The
Max Range
corresponds to the span of the image from the radar to the edge of the
picture in the East-West direction.
In the example, the range of 220 km (136.7 mi) is covered by 120 pixels to yield 2 km
(1.2 mi) per pixel resolution.
7. Select the
Layer Top
and
Layer Bottom
to the nearest 100 m (328 ft 1 in).
When selecting the layer top value, remember the maximum data height allowed for
your system as configured in the
Setup
utility.
In the example, the layer spans 0 to 16 km (0 to 9.9 mi). The corresponding side panel
resolution is set to 32 pixels so that each pixel represents 0.5 km (0.3 mi). The center of
the bottom pixel is at 0.25 km (0.2 mi) height and the center of the top pixel is at
15.75 km (9.8 mi) height.
IRIS Product and Display User Guide
M211319EN-H
46
RESTRICTED
Содержание IRIS
Страница 1: ...M211319EN H RESTRICTED User Guide IRIS Radar IRIS Product and Display...
Страница 12: ...IRIS Product and Display User Guide M211319EN H 10 RESTRICTED...
Страница 71: ...Chapter 3 Configuring IRIS Products RESTRICTED 69...
Страница 294: ...To add icons you must include a text next to the icon IRIS Product and Display User Guide M211319EN H 292 RESTRICTED...
Страница 303: ...Figure 103 Typical Spectrum Plot Appendix A Basic Radar Meteorology RESTRICTED 301...
Страница 324: ...Figure 109 Example of Volume Rendering IRIS Product and Display User Guide M211319EN H 322 RESTRICTED...
Страница 329: ...C 8 Using the Product Information Tool Figure 113 Product Information Tool Appendix C IRIS 3DView RESTRICTED 327...
Страница 386: ......
Страница 392: ......
Страница 393: ......
Страница 394: ...www vaisala com...

