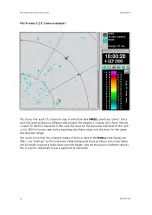
2. Place the cursor in the display window and right-click the mouse.
IRIS checks for the nearest rain gage location, and shows a rain gage datagram with 12
hours of history.
The following example shows the hourly rainfall accumulation for the last 12 hours.
Figure 57 Raingage Datagram
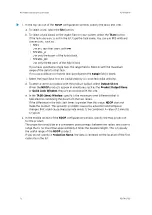
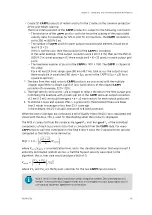
You can configure the graph show just the rain accumulations from the rain gage, or
radar rain accumulations from
RAIN1
products, or both.
3. If you are displaying radar rain accumulations, select which named
RAIN1
product to
display from.
The selected
RAIN1
product becomes the default
RAIN1
used as the topmost overlaid
product. If there is no overlaid
RAIN1
, then its default is off.
If you change the default
RAIN1
, future datagrams use the new product, until all
datagrams are dismissed.
You can show up to 10 rain gage datagrams simultaneously. This allows you to compare
different gages, or
RAIN1
products.
5.5
NDOP
: Multiple Doppler
NDOP
provides a mechanism for including velocity (Doppler) data from another radar site
now enabling the measurement of horizontal wind in addition to vertical wind.
A single Doppler radar measures one component of a 3D wind vector, that is, the
component of wind towards or away from the radar: the radial wind. We can think of the 3D
wind vector as being made up of the 2D horizontal wind and the vertical wind. Typically the
horizontal wind is much stronger than the vertical wind, except in local areas of strong
convection.
With a second Doppler radar, we can measure 2 components of the wind, provided that the
radar beams are crossing at some angle (not parallel). If the vertical component of the wind
is assumed to be small, then with 2 radars we can measure the horizontal wind.
Chapter 5 – Configuring and Scheduling Optional IRIS Products
RESTRICTED
167
Содержание IRIS
Страница 1: ...M211319EN H RESTRICTED User Guide IRIS Radar IRIS Product and Display...
Страница 12: ...IRIS Product and Display User Guide M211319EN H 10 RESTRICTED...
Страница 71: ...Chapter 3 Configuring IRIS Products RESTRICTED 69...
Страница 294: ...To add icons you must include a text next to the icon IRIS Product and Display User Guide M211319EN H 292 RESTRICTED...
Страница 303: ...Figure 103 Typical Spectrum Plot Appendix A Basic Radar Meteorology RESTRICTED 301...
Страница 324: ...Figure 109 Example of Volume Rendering IRIS Product and Display User Guide M211319EN H 322 RESTRICTED...
Страница 329: ...C 8 Using the Product Information Tool Figure 113 Product Information Tool Appendix C IRIS 3DView RESTRICTED 327...
Страница 386: ......
Страница 392: ......
Страница 393: ......
Страница 394: ...www vaisala com...


