


11
SV106A User Manual
[Info]
The
<Info>
push-button (simultaneous pressing the
<
>
,
<
>
push-buttons) opens the window with the help
information in the measurement display modes.
[Markers]
The
Markers
combination buttons enable the user to mark special events which occurred
during the performed measurements. Event function is active only when the Logger is active.
In order to activate the markers, the logger should be switched on (
path: <Menu> /
Measurement / General Settings / Logger Mode = Logger
) and one or more logger results
(
PEAK
,
P
–P
,
MAX
,
RMS
,
VDV
) in profiles have to be activated (
path: <Menu> / Measurement
/ Data Logging / Logger Results
).
In order to enter the marker mode, the user must press
<Shift>
and
<Alt>
push-buttons simultaneously during the measurement (available when
instrument operates in Advanced Mode). Then four available markers
appear on the screen. To choose marker number 1 the user must press
<
>
push button (number 2 -
<
>
, number - 3
<
>
and number 4 -
<
>
).
The markers disappear automatically and the chosen marker is activated
(after pressing
<Shift>
+
<Alt>
again, the active marker number will be
highlighted). To switch off the marker, the user has to press
<Shift>
+
<Alt>
and press the arrow push-button, which refers to the marker to be switched
off.
The current state of the markers is indicated in the logger file (cf. App. B for
details) and can be used to show them with the help of the dedicated
presentation software.
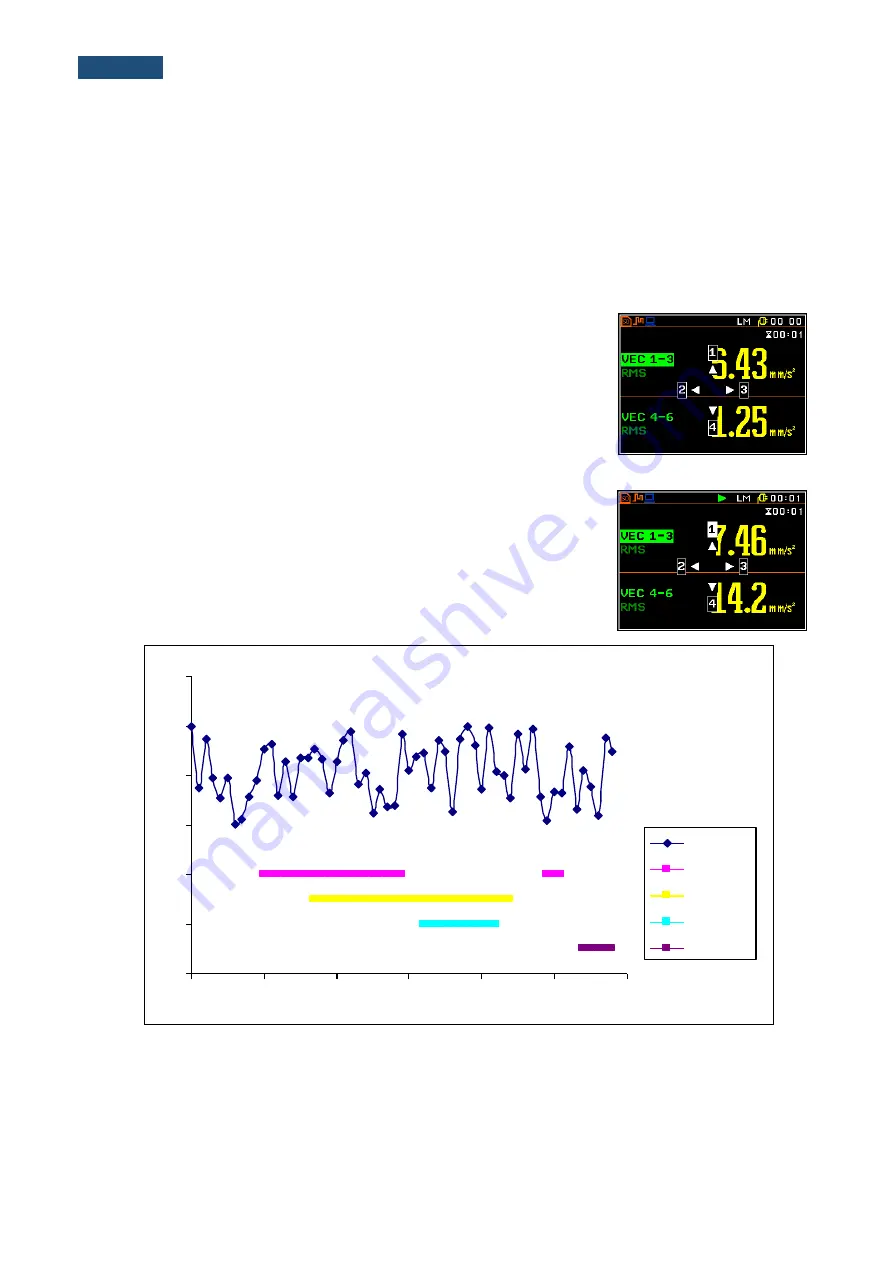
An example presentation of the markers on the time history plot is shown
below (to view a plot with markers the user has to transfer data to the
appropriate software such as Supervisor or +).
<Shift>
/
<Alt>
<
>
20
30
40
50
60
70
80
13:30:00 13:30:09 13:30:17 13:30:26 13:30:35 13:30:43 13:30:52
Leq
Marker 1
Marker 2
Marker 3
Marker 4


