Tel: 886. 909 602 109 Email: [email protected]
www.salukitec.com
41
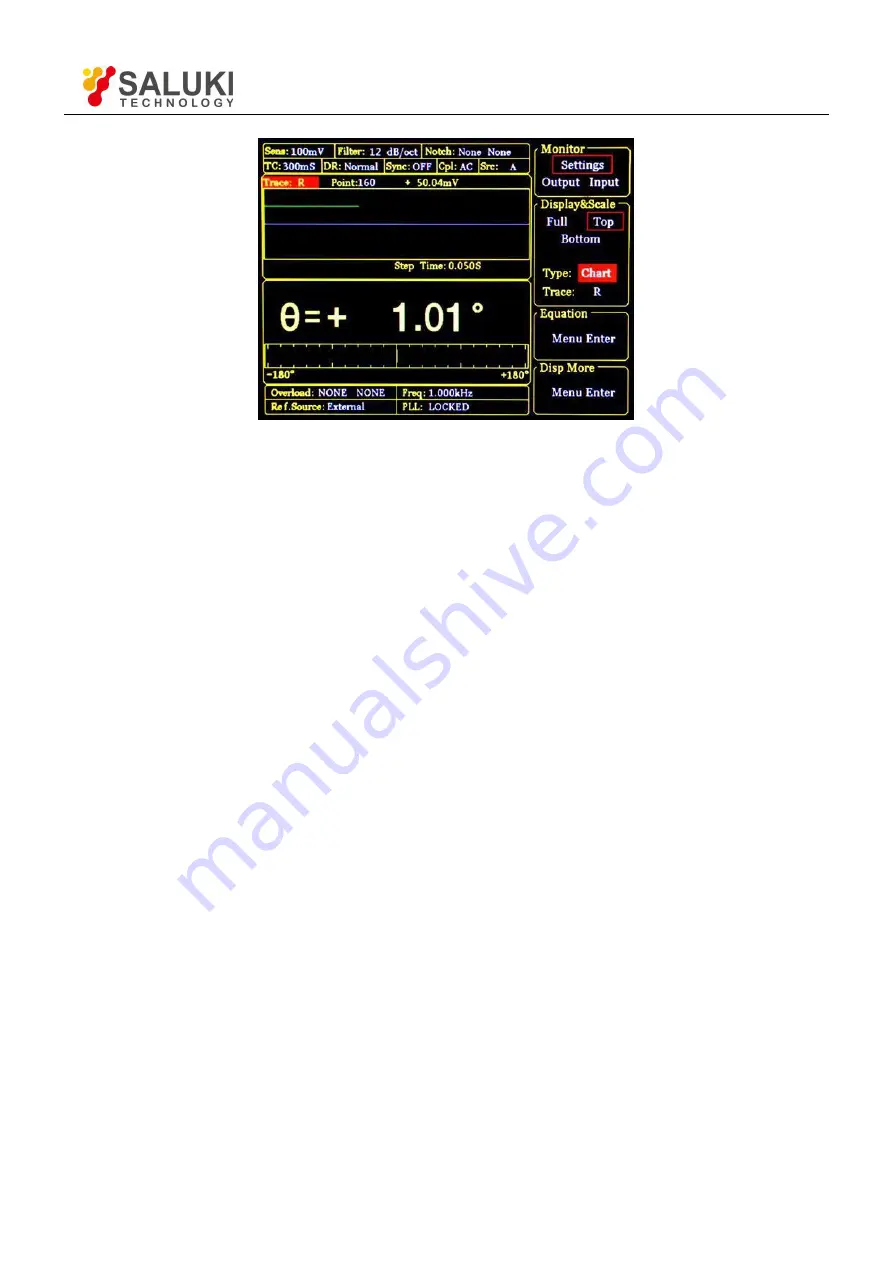
Fig.31 <Top>-<Chart> Display
<Top>
Only choose the top area to set. When <Type> or <Trace> is changed, the display way of top
area will change, as is shown in Fig.30 and Fig.31. There are two choices in <Type>,
including <Bar> and <Chart>.
If <Type> chooses <Bar>, <Trace> provides options, including fundamental wave, harmonic,
and Equation.
If <Type> chooses <Chart>, <Trace> provides options: <Buffer1>, < Buffer2>, < Buffer3>
and < Buffer4>.
<Buffer> is set by <Select> submenu of <SAMPLE>.
<Bottom>
Only choose the bottom area to set. When <Type> or <Trace> is changed, the display way of
bottom area will change, just like the <Top> mode.
<Type/Trace>
Setting the way of display
Switch <Type> or <Trace> to set by soft keys. The chosen one will be highlighted and then
switch the wanted mode through knob.
<Type>
How to display. Users can choose <polar> (polar coordinates), <chart> (XY coordinates) and
<Bar> (number percentage). Besides, <FFT> and <LIST> are optional in the <Full> mode.
<Trace>
What to display. Users can choose the values to display as the following.
<X>
The X value of fundamental wave of the input signal.
<Y>
The Y value of fundamental wave of the input signal.
<R>
The R value of fundamental wave of the input signal.
<θ>
The θ value of fundamental wave of the input signal.
<Xh1>
The X value of 1th channel harmonic of the input signal.
<Yh1>
The Y value of 1th channel harmonic of the input signal.


