Tel: 886. 909 602 109 Email: [email protected]
www.salukitec.com
26
Fig.12 Main Interface: Status Bar 2
(2) Data Bar
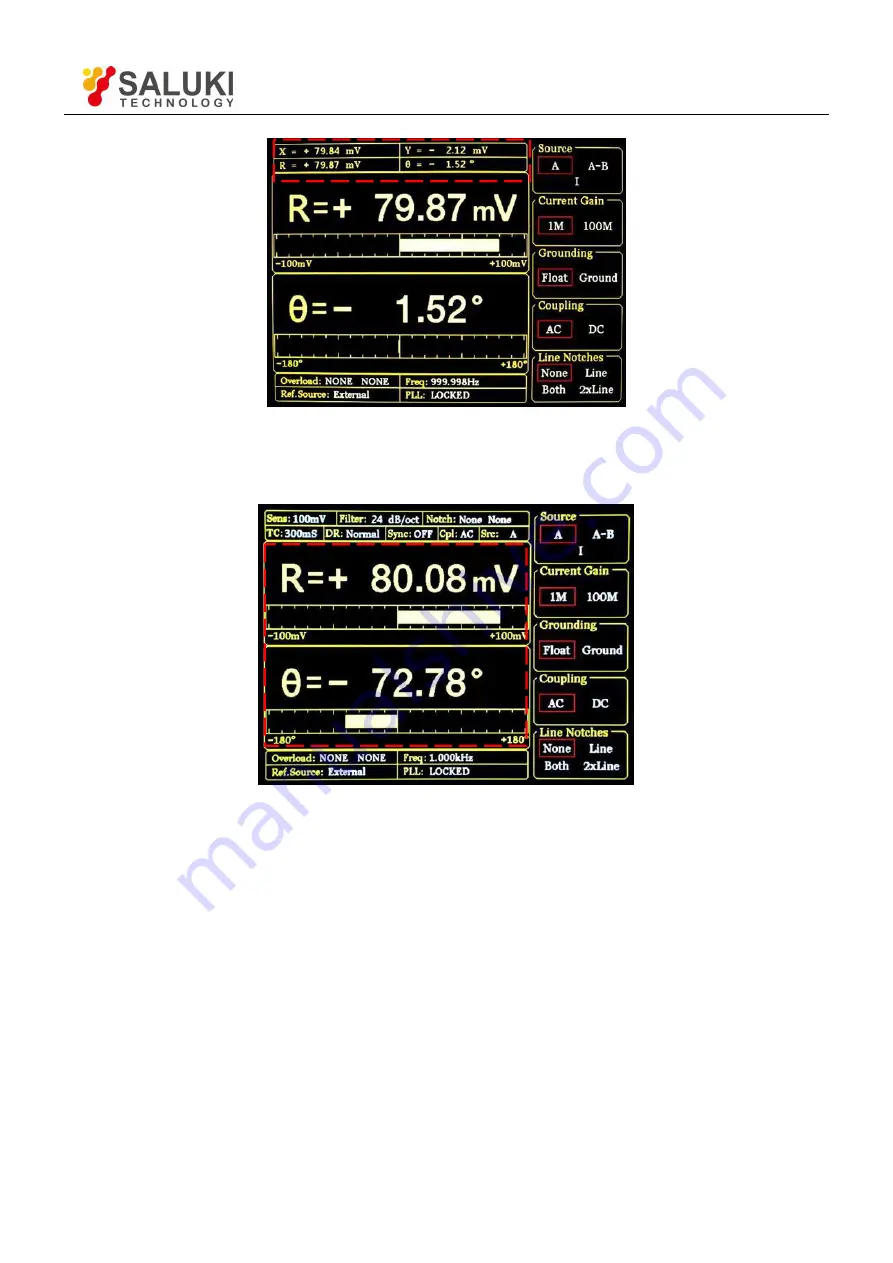
Fig.13 Main Interface: Data Bar
Users can choose which to display among <X>, <Y>, <R>, <
θ
> in [DISPLAY] submenu, as shown in Fig.13. How to
display is also optional, such as number chart, bar chart, XY coordinate graph and pole coordinate graph. More details
about setting is in [DISPLAY] submenu.
(3) Monitoring Bar
The monitoring bar is at the bottom of the screen as is shown in Fig.14:
<Overload>
To indicate an input overload or amplification overload.
If there is no overload, it shows <Overload: NONE NONE>; If an input
overload, it shows <Overload: INPUT NONE>;
If an amplification overload, it shows <Overload: NONE GAIN>;


