ProSecure Web/Email Security Threat Management (STM) Appliance Reference Manual
Monitoring System Access and Performance
6-19
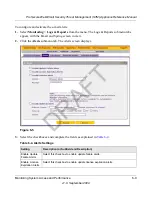
v1.0, September 2009
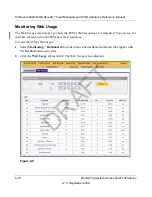
3.
Use the
From
pull-down menu to select the start date of the Web usage report (year, month,
date) and the
To
pull-down menu to select the end date of the report (year, month, date).
4.
Click
View
. The STM generates a Web usage report.
The Web usage reports shows the following columns:
•
TOP
. The Web usage ranking.
•
Category
. The Web category, including spam sites and Web applications.
•
Requests
. The number of requests for the category.
•
% of Requests
. The percentage of requests for the category in relation to the total number
of Web requests.
•
IPs
. The number of IP addresses that request the category.
•
% of IPs
. The percentage of IP addresses that request the category in relation to the total
number of IP addresses.
•
Blocked
. Whether or not the category is blocked by the STM.
Viewing System Status
The System Status screen provides real-time information about the following components of the
STM:
•
Firmware versions and update information of the STM, software versions and update
information of the components, license expiration dates for each type of license, and hardware
serial number.
•
Management interface information.
•
MAC addresses for the STM’s interfaces.
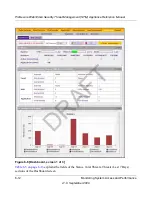
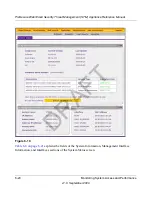
To view the System Status screen click
Monitoring
>
System Status
.
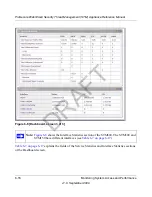
Figure 6-10 on page 6-20
displays the System Status screen of the STM600. The Interfaces section of the System Status
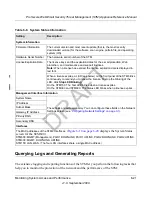
screen differ for STM300 and STM150 (see
Table 6-8 on page 6-21
).
DRAFT
Содержание STM150 - ProSecure Web And Email Threat Management Appliance
Страница 6: ...v1 0 September 2009 vi D R A F T ...

