ProSecure Web/Email Security Threat Management (STM) Appliance Reference Manual
Monitoring System Access and Performance
6-11
v1.0, September 2009
Understanding the Information on the Dashboard Screen
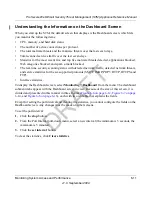
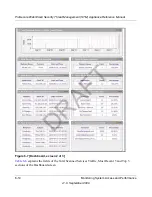
When you start up the STM, the default screen that displays is the Dashboard screen, which lets
you monitor the following items:
•
CPU, memory, and hard disk status.
•
The number of active connections per protocol.
•
The total malware threats and the malware threats over the last seven days.
•
Total scanned services traffic over the last seven days.
•
Statistics for the most recent five and top five malware threats detected, applications blocked,
Web categories blocked, and spam e-mails blocked.
•
The real-time security scanning status with detected network traffic, detected network threats,
and service statistics for the six supported protocols (SMTP, IMAP, POP3, HTTP, HTTPS and
FTP).
•
Interface statistics.
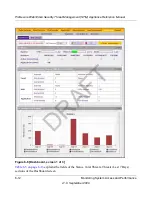
To display the Dashboard screen, select
Monitoring
>
Dashboard
from the menu. The dashboard
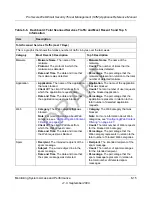
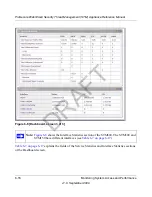
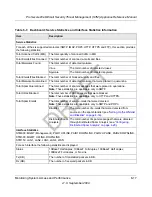
submenu tabs appear with the Dashboard screen in view. Because of the size of this screen, it is
divided and presented in this manual in three figures (
Figure 6-6 on page 6-12
,
Figure 6-7 on page
6-14
, and
Figure 6-8 on page 6-16
), each with its own table that explains the fields.
Except for setting the poll interval and clearing the statistics, you cannot configure the fields on the
Dashboard screen. Any changes must be made on other screens.
To set the poll interval:
1.
Click the
stop
button.
2.
From the Poll Interval pull-down menu, select a new interval (the minimum is 5 seconds, the
maximum is 5 minutes).
3.
Click the
set interval
button.
To clear the statistics, click
Clear statistics
.
DRAFT
Содержание STM150 - ProSecure Web And Email Threat Management Appliance
Страница 6: ...v1 0 September 2009 vi D R A F T ...

