Model 4200A-SCS Parameter Analyzer Reference Manual
Section 6: Clarius
4200A-901-01 Rev. C / February 2017
6-213
3. In the Text box, enter the comment.
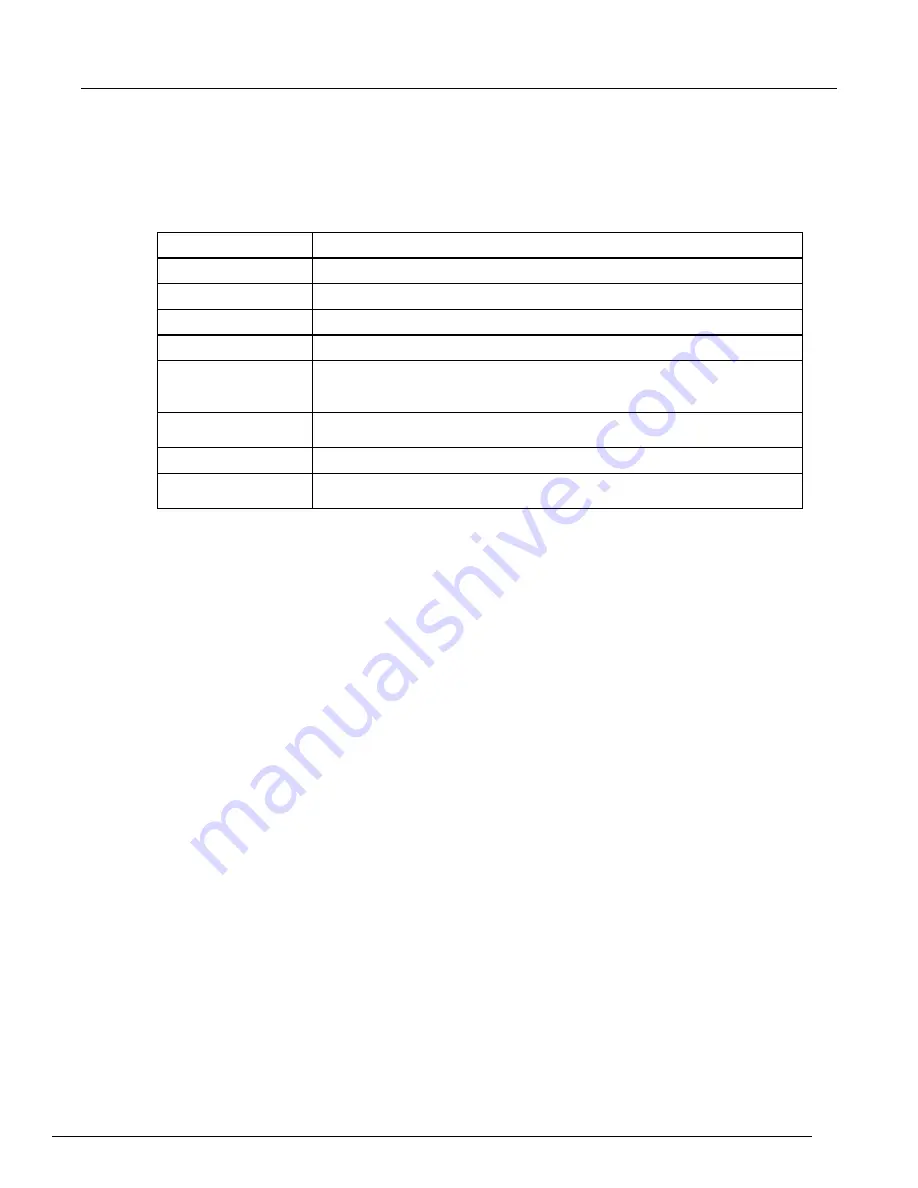
4. Change the appearance of the comment as needed. See the table below for descriptions of the
options.
5. Click
OK
. The comment displays on the graph in the upper left corner.
6. If needed, drag the comment to a new location on the graph.
Description
Text
The comment. Comments can be up to 272 characters long.
Display Font
The font of the text.
Foreground
The color of the text.
Background
The background color.
Transparent
Select to display the box with a transparent background. Clear to make the
background solid.
Note that selecting Transparent sets the background color selection to light gray.
Border
Changes the type of outline around the box. Width must be set to a value other
than 0 in order for the border to be displayed.
Width
The width of the display border (0 to 20).
Visible
Select to display the comment. Clear to hide the comment. The settings are
maintained when the comments are hidden.
Display data variables
Opens the Data Variables dialog box, from which you can configure the display of up to four data
variables, along with the corresponding names. Data variables are extracted parameters or other
values from the second row of a Run or Calc worksheet. For example, you can display calculated,
single-value extracted parameters, such as curve slopes and saturation values. In the Run
worksheet, these parameters are in the second row of an otherwise empty column. The Data
Variables menu item also toggles the display of the data variables.
For consistency with frequent industry usage, each second-row value (normally the first data value in
a column [series] of data) is referred to as a data variable. Each first row value of a Run and Calce
worksheet contains the name of the data variable. If you select multiple data variables, all selected
values are displayed together in a single text block, which may be anywhere in the graph.
To display values from the Run tabs on the graph:
1. Select
Analyze
.
2. On the graph, right-click and select
Data Variables 1
or
Data Variables 2
. Both options have the
same choices.
3. From the
Sheet:Column
list, select the sheet and column of data you want to display. You can
select up to four items. The items you select are displayed in the Data Variables list.
4. Change the appearance of the data as needed. See the table below for descriptions of the
options.
5. Click
OK
. The data variables are displayed on the graph.
6. Drag the data variable box to a new location on the graph if needed.


