


DATA ANALYSIS
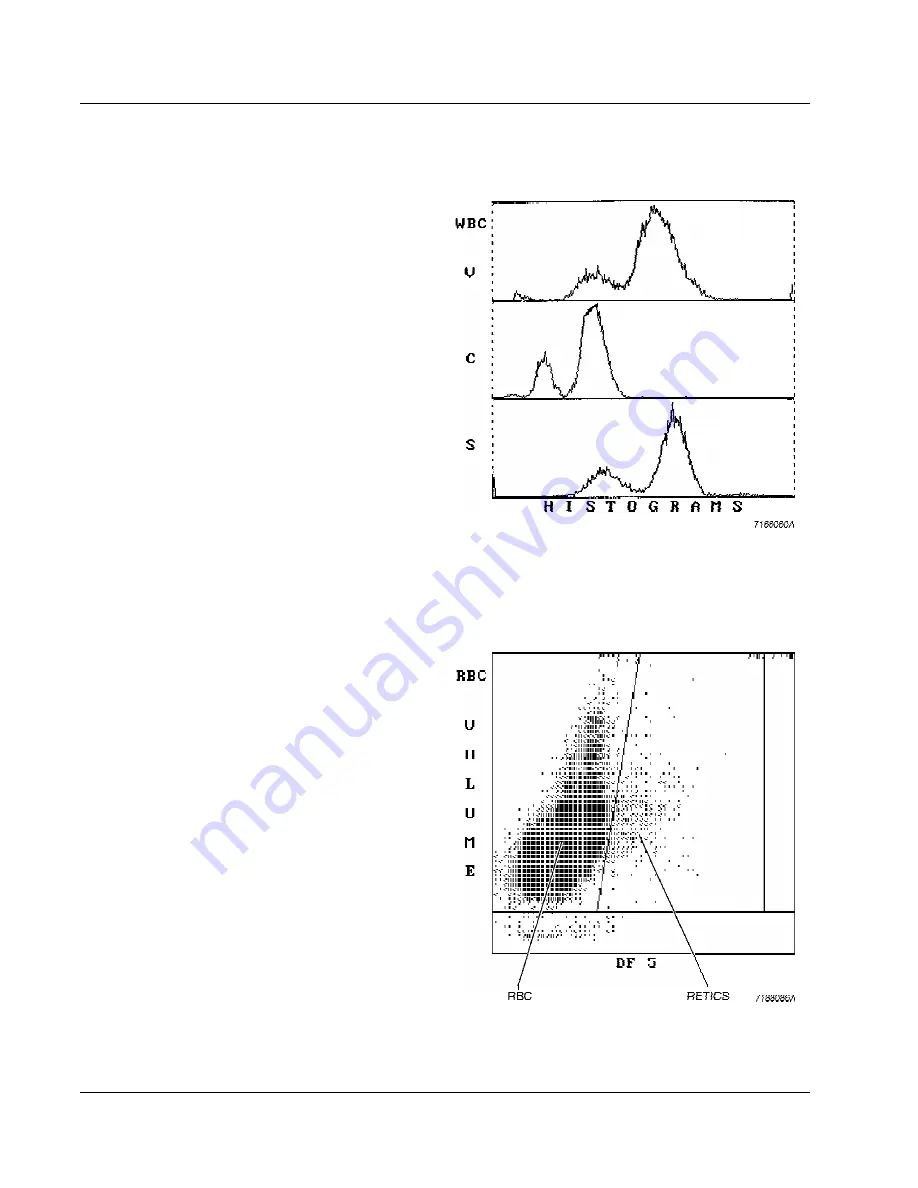
Single Parameter Histograms
Single parameter histograms of volume,
conductivity and light scatter are also available
for Diff and Retics. These are used primarily for
troubleshooting by Service.
RETICULOCYTE SCATTERPLOTS
DF 5 Scatterplot
This is the initial display of Retic analysis. It
derives primarily from light scatter and volume.
The Y axis represents volume. Mature RBCs
appear to the left of the Retic discriminator.
Retics appear to the right of it. WBCs appear high
to the far right.
78
PN 4237188A (December 1993)
Содержание STKS
Страница 16: ...CONTROLS AND INDICATORS 6 PN 4237188A December 1993...
Страница 84: ...SAMPLE ANALYSIS 74 PN 4237188A December 1993...
Страница 98: ...DATA ANALYSIS 88 PN 4237188A December 1993...
Страница 124: ...DMS BASICS 114 PN 4237188A December 1993...
Страница 130: ...RUN SAMPLES DISPLAY 120 PN 4237188A December 1993...
Страница 168: ...DATA BASE 158 PN 4237188A December 1993...
Страница 204: ...APPENDIX A 194 PN 4237188A December 1993...
Страница 216: ...APPENDIX C 206 PN 4237188A December 1993...
Страница 228: ...APPENDIX D 218 PN 4237188B March 1995...
Страница 230: ...REFERENCES 220 PN 4237188B March 1995...
Страница 236: ......