


DATA ANALYSIS
CBC HISTOGRAMS
IMPORTANT
Do not estimate the number of cells from the distribution curves. Curves show only the relative, not
actual, number of cells in each size range.
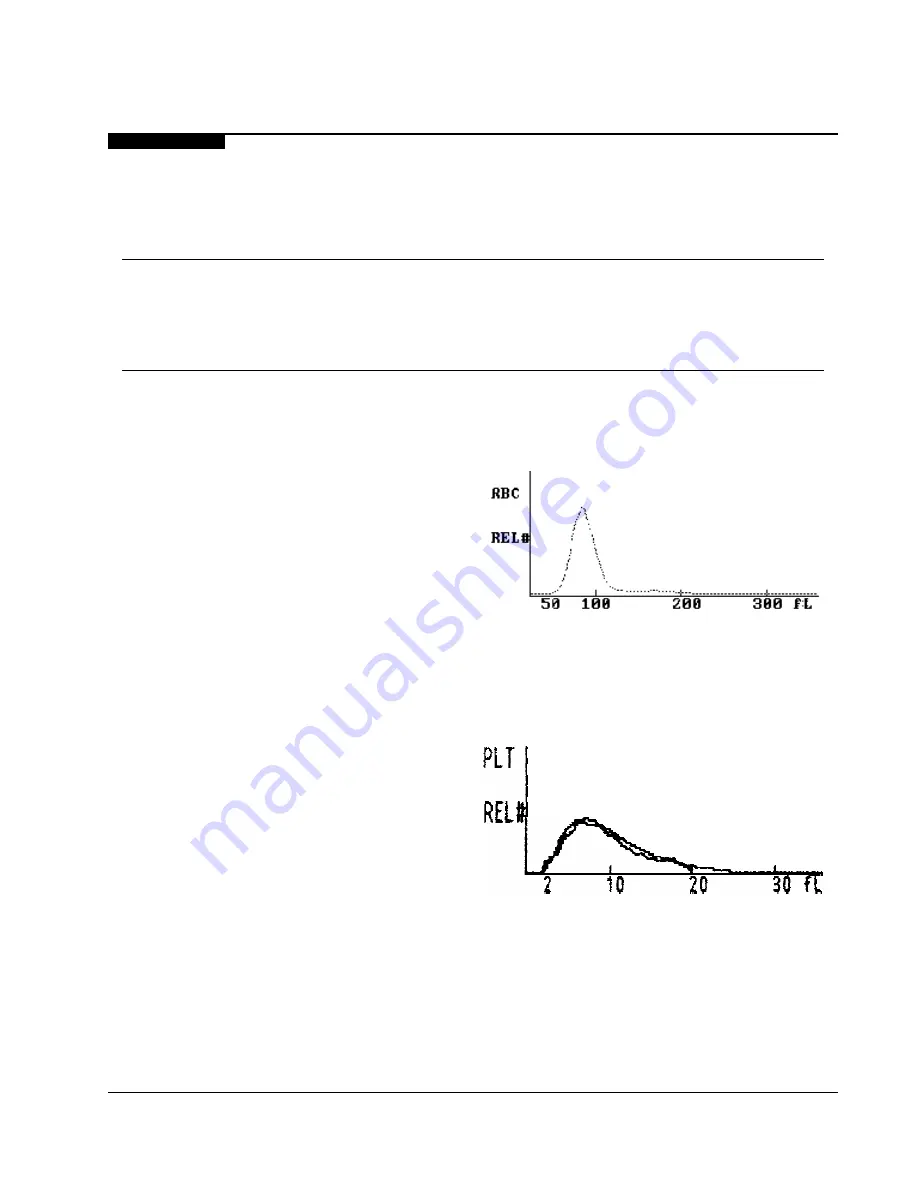
RBC Distribution Curve
The normal RBC curve ranges from 36 to 360 fL.
The display starts at 24 fL.
5935-141
Plt Distribution Curve
Normal Plt distribution yields two curves, both
using averaged data. The
•
smooth curve derives from raw data and
displays between 2 fL and 20 fL.
•
fitted curve ranges from 0 to 70 fL and is
used to derive the Plt count. Only the area
between 0 fL and 36 fL displays.
5935-140
PN 4237188A (December 1993)
75
Содержание STKS
Страница 16: ...CONTROLS AND INDICATORS 6 PN 4237188A December 1993...
Страница 84: ...SAMPLE ANALYSIS 74 PN 4237188A December 1993...
Страница 98: ...DATA ANALYSIS 88 PN 4237188A December 1993...
Страница 124: ...DMS BASICS 114 PN 4237188A December 1993...
Страница 130: ...RUN SAMPLES DISPLAY 120 PN 4237188A December 1993...
Страница 168: ...DATA BASE 158 PN 4237188A December 1993...
Страница 204: ...APPENDIX A 194 PN 4237188A December 1993...
Страница 216: ...APPENDIX C 206 PN 4237188A December 1993...
Страница 228: ...APPENDIX D 218 PN 4237188B March 1995...
Страница 230: ...REFERENCES 220 PN 4237188B March 1995...
Страница 236: ......