


3.22
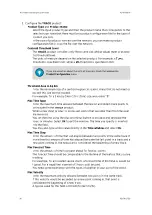
VAD
: Velocity Azimuth Display
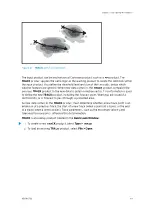
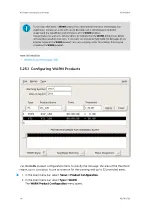
Figure 32
VAD
Example Configuration
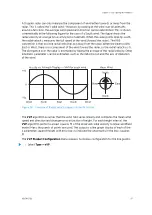
VAD
is a display of the mean Doppler velocity at a given range as a function of the azimuth
angle as the radar antenna rotates through an azimuth scan at a constant elevation.
Min-Max Rng
Select the range over which to average the velocities.
The
VAD
product averages all velocities in this range for all rays, and store a structure
for each ray. This structure includes the average value, standard deviation, data count,
as well as the azimuth, elevation, and sweep number.
Unfolding
Select this option to enable unfolding the data before generating the product.
More information
‣
Associating Products with Tasks (page 17)
‣
IRIS Product and Display User Guide
M211319EN-H
92
RESTRICTED
Summary of Contents for IRIS
Page 1: ...M211319EN H RESTRICTED User Guide IRIS Radar IRIS Product and Display...
Page 12: ...IRIS Product and Display User Guide M211319EN H 10 RESTRICTED...
Page 71: ...Chapter 3 Configuring IRIS Products RESTRICTED 69...
Page 303: ...Figure 103 Typical Spectrum Plot Appendix A Basic Radar Meteorology RESTRICTED 301...
Page 386: ......
Page 392: ......
Page 393: ......
Page 394: ...www vaisala com...