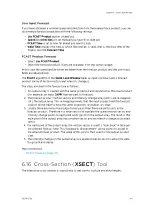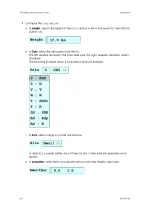
8. To avoid collision of the wind barbs in height, you can specify
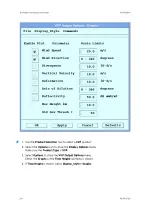
Height Step km
.
Type
0.0
to see all the data.
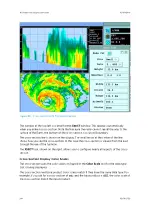
9. In some cases, the wind estimates are noisy because of weak signals or poor coverage.
If needed, use
Std Dev Thresh %
to threshold poor estimates so that they are not
displayed.
Specify a number between 0 (no thresholding) and 100 (everything thresholded away).
Typically a value of 80 is used.
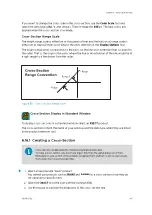
10. To test your setting, select
Apply
.
The velocity point is displayed if the following is true:
Stan dardDeviation < − In tℎresℎold
100
× 1.0 + Velocity/10.0
More information
‣
Producing VVP Product Output (page 99)
‣
VVP Output Options: Line Graphs (page 253)
‣
‣
WIND and FCAST Output Options (page 257)
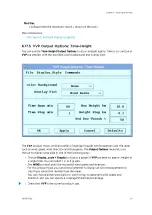
6.17.6 VVP Output Options: Line Graphs
VVP
products can be displayed in graphical format of
VVP
wind profile parameters against
height. 1, 2, or 3 graphs may be plotted side-by-side.
Chapter 6 – Quick Look Window
RESTRICTED
253
Summary of Contents for IRIS
Page 1: ...M211319EN H RESTRICTED User Guide IRIS Radar IRIS Product and Display...
Page 12: ...IRIS Product and Display User Guide M211319EN H 10 RESTRICTED...
Page 71: ...Chapter 3 Configuring IRIS Products RESTRICTED 69...
Page 303: ...Figure 103 Typical Spectrum Plot Appendix A Basic Radar Meteorology RESTRICTED 301...
Page 386: ......
Page 392: ......
Page 393: ......
Page 394: ...www vaisala com...


