


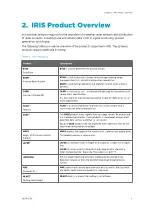


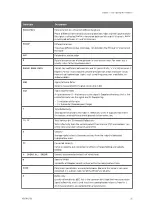


Product
Description
PPI
Plan Position Indicator
PPI
is a full screen image used primarily for weather surveillance
purposes.
RAIN1
Hourly Rain Accumulation
RAIN1
is hourly rainfall accumulation.
N
-Hour Rain Accumulation
RAINN
is rainfall accumulation of the last
N
hours, where
N
is selected by
the user.
RAW
Raw Data Product
A
RAW
data file that contains the raw signal processor output
parameters (
Z
,
ZT
,
V
,
W
,
ZDR
, and so on) in polar coordinates.
A
RAW
file contains all the information collected during a measurement
task. It is compressed so it can be sent over the network to IRIS Analysis.
While
RAW
data cannot be displayed, it is useful for recording on tape/
disk/DVD or transferring to another IRIS network computer for product
generation.
RTI
Range Time Indicator
RTI
displays time along the horizontal axis and the vertical axis displays
range from the radar.
Often used for manual scans when observing a fixed target.
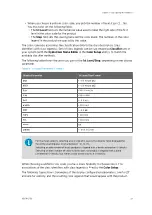
Range Height Indicator
RHI
is a full screen image showing the detailed cross-sectional structure
of a storm, used for identifying severe storms, hail and bright band.
SRI
Surface Rainfall Intensity
SRI
provides input for the
RAIN1
product to obtain the best possible
estimates of accumulated precipitation even at longer ranges from the
radar.
STAT
Radar System Status
A
STAT
file contains a report indicating the state of all key components
of the radar software.
THICK
Echo Thickness
THICK
shows the thickness of cloud echoes.
THICK
is the same as the difference between the
TOPS
and
BASE
values.
The
THICK
product also computes the average reflectivity in the layer
identified by the selected
dBZ Contour
.
TOPS
Echo Tops Map
TOPS
is a color-coded contour map of the top of a selected dBZ level.
Either
Z
or
ZT
can be used as the basis for the estimate.
TRACK
Interactive Storm Tracking and
Forecasting
TRACK
products show the projected motion for storm features
(centroids) based on a series of input products from different times.
TRACK
is an overlay product created in the
Quick Look Window
.
VAD
Velocity Azimuth Display
VAD
is a display of the mean Doppler velocity at a given range as a
function of the azimuth angle as the radar antenna rotates through an
azimuth scan at a constant elevation.
VIL
Vertically Integrated Liquid
VIL
is a color-coded map of the estimated depth of water (in mm)
contained in a selectable atmospheric layer. This is an excellent indicator
of severe storms.
Either
Z
or
ZT
can be used as the basis for the estimate.
VVP
Velocity Volume Processing
VVP
provides line graphs or time against height cross-sections of wind
speed, wind direction and divergence against height.
You can select the range of influence and the maximum height.
IRIS Product and Display User Guide
M211319EN-H
14
RESTRICTED
Summary of Contents for IRIS
Page 1: ...M211319EN H RESTRICTED User Guide IRIS Radar IRIS Product and Display...
Page 12: ...IRIS Product and Display User Guide M211319EN H 10 RESTRICTED...
Page 71: ...Chapter 3 Configuring IRIS Products RESTRICTED 69...
Page 303: ...Figure 103 Typical Spectrum Plot Appendix A Basic Radar Meteorology RESTRICTED 301...
Page 386: ......
Page 392: ......
Page 393: ......
Page 394: ...www vaisala com...