


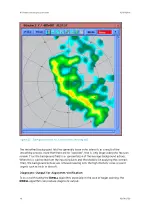


Figure 50
DWELL
of
PPI
for the Previous 2 Hours Showing
dBZ
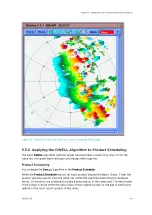
The final figure in the example shows the age of the
DWELL
data points, that is, the number
of minutes since the most recent
PPI
product in the sequence. The color scale is configured
so that blue shows the most recent echoes while red shows the oldest echoes.
The example shows blue on the left (West) where the current echo is located. The red
echoes on the right (East) are the older echoes from earlier in the sequence. This is to be
expected for general East to West motion. Residual clutter shows a speckled pattern (for
example, at 50 km (31.1 mi) to the Northeast).
IRIS Product and Display User Guide
M211319EN-H
142
RESTRICTED
Summary of Contents for IRIS
Page 1: ...M211319EN H RESTRICTED User Guide IRIS Radar IRIS Product and Display...
Page 12: ...IRIS Product and Display User Guide M211319EN H 10 RESTRICTED...
Page 71: ...Chapter 3 Configuring IRIS Products RESTRICTED 69...
Page 303: ...Figure 103 Typical Spectrum Plot Appendix A Basic Radar Meteorology RESTRICTED 301...
Page 386: ......
Page 392: ......
Page 393: ......
Page 394: ...www vaisala com...