


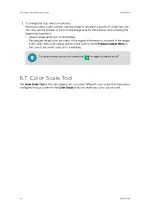


6.7.1 Highlight Tool
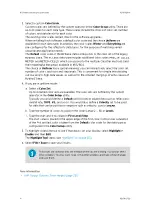
The
Highlight Tool
, launched from the
Color Scale Tool
, lets you highlight one particular
data interval to see if that data is on your display.
Use this tool to select color intervals (from the 16 intervals in the legend). You can set the
color for that interval using the color scroll bars. Those data values on the display are shown
in the new color.
6.8 Display Options Tool - IRIS Product
Output
The
Display Options
tool allows you to select display components such as geographic
overlays, range rings, drop shadows, and even the overlay of multiple products, warning
centroids, and echo tracks, along with adjusting the product overlay opacity. Select the icon
to display the tool.
Chapter 6 – Quick Look Window
RESTRICTED
213
Summary of Contents for IRIS
Page 1: ...M211319EN H RESTRICTED User Guide IRIS Radar IRIS Product and Display...
Page 12: ...IRIS Product and Display User Guide M211319EN H 10 RESTRICTED...
Page 71: ...Chapter 3 Configuring IRIS Products RESTRICTED 69...
Page 303: ...Figure 103 Typical Spectrum Plot Appendix A Basic Radar Meteorology RESTRICTED 301...
Page 386: ......
Page 392: ......
Page 393: ......
Page 394: ...www vaisala com...


