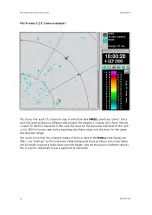
Pile Product (2X Zoom example)
This shows the result of correlation step in which the time
DWELL
points are "piled". Since
each trial wind produces a different pile product, the diagnostic output only shows the pile
product for the first trial wind. In this case the result for the particular trial wind of 210° and
12 m/s (39 ft 4 in) was selected by inputting only these values into the limits for the speed
and direction ranges.
The results show that the coherent streaks of echo as seen in the
DWELL
time display are
effectively "piled-up" by this trial wind, while background noise produces only weak values.
Not all streaks produce a large value since the targets may be moving at a different velocity.
This is why it is important to use a spectrum of trial winds.
IRIS Product and Display User Guide
M211319EN-H
162
RESTRICTED
Summary of Contents for IRIS
Page 1: ...M211319EN H RESTRICTED User Guide IRIS Radar IRIS Product and Display...
Page 12: ...IRIS Product and Display User Guide M211319EN H 10 RESTRICTED...
Page 71: ...Chapter 3 Configuring IRIS Products RESTRICTED 69...
Page 303: ...Figure 103 Typical Spectrum Plot Appendix A Basic Radar Meteorology RESTRICTED 301...
Page 386: ......
Page 392: ......
Page 393: ......
Page 394: ...www vaisala com...

