3D Graphing
401
•
Because of possible long evaluation times, you first may want to experiment with
your 3D equation by using Style=WIRE FRAME. The evaluation time is much
shorter. Then, after you’re sure you have the correct Window variable values,
display the Graph Formats dialog box and set Style=CONTOUR LEVELS or WIRE
AND CONTOUR.
8
F
Example: Contours of a Complex Modulus Surface
Example: Contours of a Complex Modulus Surface
Example: Contours of a Complex Modulus Surface
Example: Contours of a Complex Modulus Surface
The complex modulus surface given by
z(a,b) = abs(f(a+b
i
))
shows all the complex zeros
of any polynomial
y=f(x)
.
Example
Example
Example
Example
In this example, let f(x)=x
3
+1. By substituting the general complex form x+y
i
for x, you
can express the complex surface equation as z(x,y)=abs((x+y
i)
3
+1).
1. Use
3
to set
Graph=3D
.
2. Press
8 #
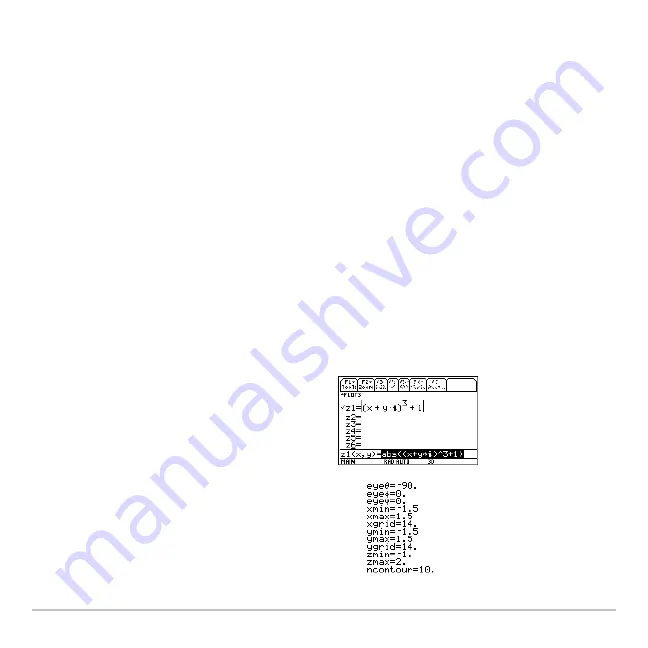
, and define the equation:
z1(x,y)=abs((x+y
ù
i
)^3+1)
3. Press
8 $
, and set the Window
variables as shown.
Summary of Contents for Voyage 200
Page 36: ...Getting Started 36 D B D B Press Result ...
Page 45: ...Getting Started 45 3 0 D B D D B D Press Result ...
Page 46: ...Getting Started 46 D 2 0 0 2 D B Scroll down to October and press Press Result ...
Page 60: ...Getting Started 60 B D Press Result ...
Page 139: ...Previews 139 8 Complete the operation Press 2 d Steps and keystrokes Display 5 f 2 ...
Page 453: ...Differential Equation Graphing 453 ...
Page 468: ...Tables 468 ...
Page 777: ...Activities 777 ...


