


Data Input and Output
CSA8000B & TDS8000B User Manual
3- 131
Overview
Control elements & resources
To use exported waveforms (cont.)
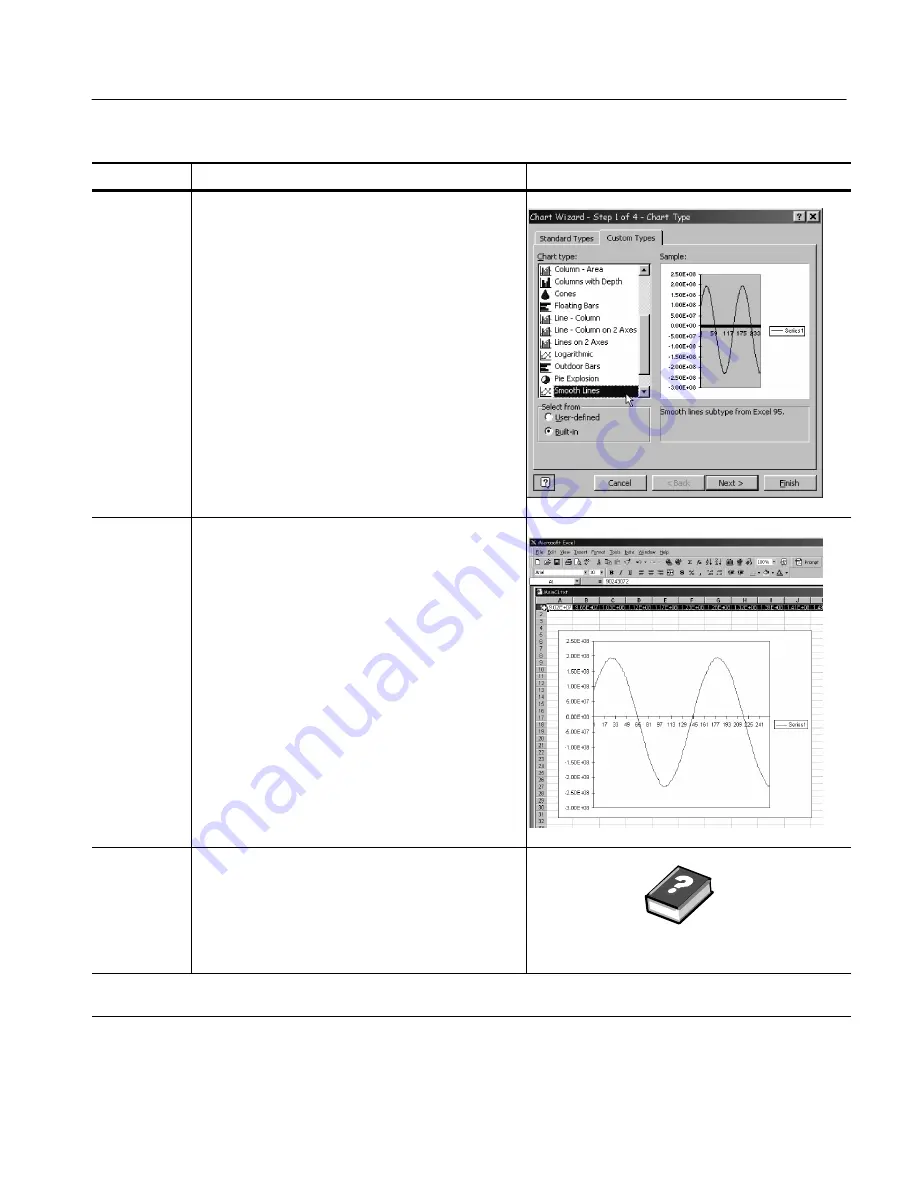
Specify a
line-graph
chart
7.
From the Chart Wizard, make sure
Built In
is checked.
Then select the either
Lines
in the
Standards Types
tab or
Smooth lines
in the
Custom Types
tab. (See
illustration at right.)
Finish the
chart
8.
Click
Next
to step through the next two steps
accepting the defaults settings at each step. Click the
Finish
button in step 4. You should have a waveform
display similar to that show right.
Tip.
This procedure assumes MS Excel 97. You can
likely specify titles, customize the treatment and
labeling of the x and y axes, etc. in your data-analysis
application—either as you create the chart or
afterward. Use the help for your data-analysis
application to determine if it has these capabilities
and for instructions in using them.
For more
information
9.
For more help on exporting waveforms., press the
Help
button in the dialog box to access contextual
online help.
See page 3--167 to learn about accessing online help
.
End of Procedure
Summary of Contents for CSA8000B Series
Page 4: ......
Page 18: ...Preface xiv CSA8000B TDS8000B User Manual ...
Page 26: ...Check the Package Contents 1 8 CSA8000B TDS8000B User Manual ...
Page 62: ...Accessories and Options 1 44 CSA8000B TDS8000B User Manual ...
Page 76: ...Overview 3 2 CSA8000B TDS8000B User Manual ...
Page 112: ...Acquiring Waveforms 3 38 CSA8000B TDS8000B User Manual ...
Page 126: ...Triggering 3 52 CSA8000B TDS8000B User Manual ...
Page 146: ...Displaying Waveforms 3 72 CSA8000B TDS8000B User Manual ...
Page 174: ...Measuring Waveforms 3 100 CSA8000B TDS8000B User Manual ...
Page 186: ...Creating Math Waveforms 3 112 CSA8000B TDS8000B User Manual ...
Page 214: ...Data Input and Output 3 140 CSA8000B TDS8000B User Manual ...
Page 353: ......
Page 354: ......


