Instruction Manual
95
4.4.1.1.3
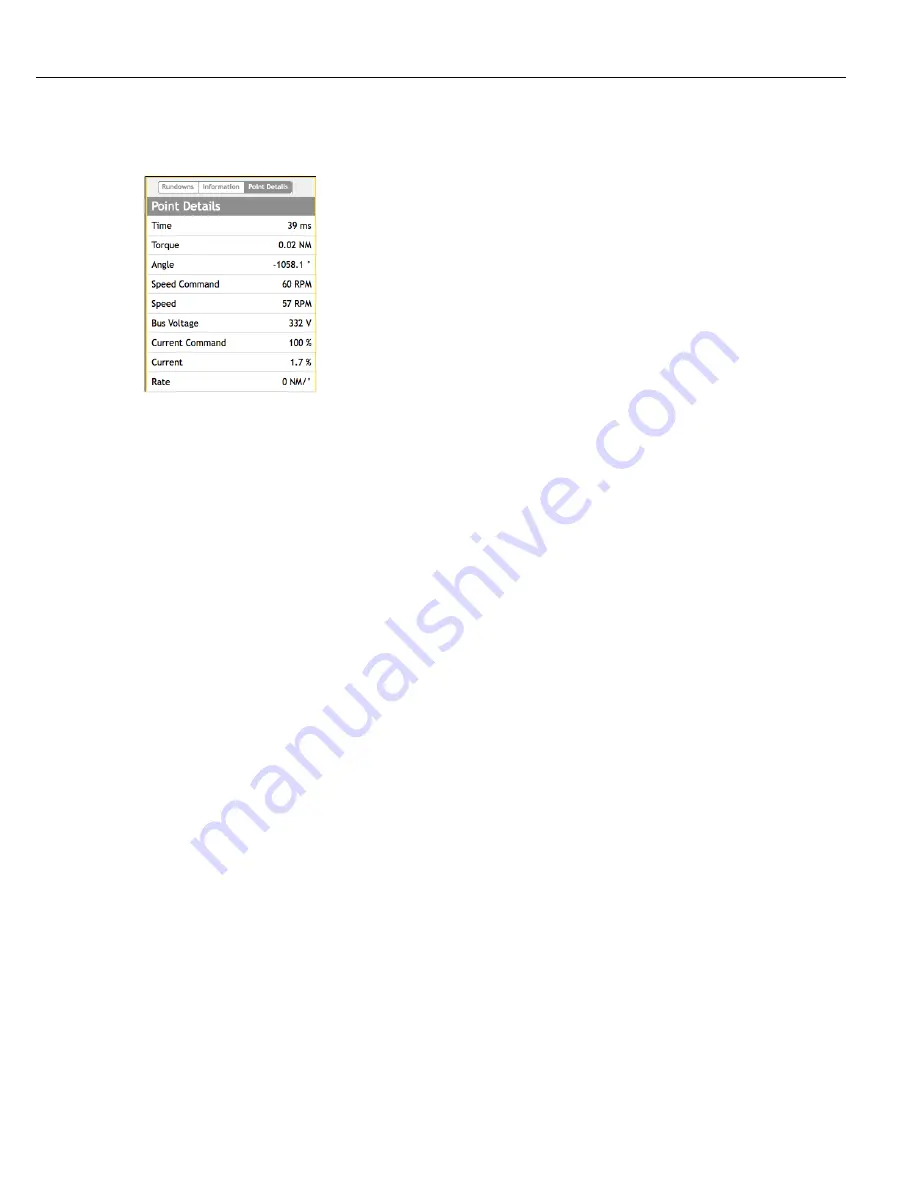
Point Details
Click on the Points Detail button to display information about the selected fastening cycle. Use the mouse to
hover over the drawn trace graph on the right in the Trace screen. The values in the Points Detail window change
with the mouse hover.
Time – The time in milliseconds the point occurred in the fastening cycle from start.
Torque – The torque achieved at the mouse hover point.
Angle – The angle achieved at the mouse hover point.
Speed Command – The commanded speed at the mouse hover point.
Speed – The actual tool speed achieved at the mouse hover point.
Bus Voltage – The actual DC Bus voltage achieved at the mouse hover point.
Current Command – The commanded current at the mouse hover point.
Current – The actual tool current achieved at the mouse hover point.
Torque Rate – The actual torque rate achieved at the mouse hover point. This values is derived by using the
Torque Rate algorithm associated with the parameters Torque Average (ms) and Angle Interval.
4.4.1.1.4
Clicking the Print button will open the printer dialog. This window allows the user to modify printer parameters
and displays what is to be printed. The currently selected Y axis values are printed separately in their own box on
the same page. The X axis is either Time or Angle depending on the current selection.
If no physical printer is attached, choose an installed PDF printer to save as a PDF file.
4.4.1.1.5
Export
Click the Export button to save the selected fastening cycle trace file to the computer. Choose between the
selected trace, the number of traces in the population size to be exported. When exporting the selected trace it
exports as a comma seperated value file. If POPULATION is selected the appropriate number of traces are placed
into a zip file before exporting.
The exported trace file is a comma separated values file and contains four sections. They are the identifier section,
the step values sections, the trace values section and the events section.
The identifier section repeats some of the same information from the fastening cycle record so it can be correlated
with the trace file. This information is displayed when the Information button is clicked.
The step values section provides the torque, angle and current values for each step in the fastening cycle. The
fastening cycle file has only the audit step for each record. If the values for each individual step are required this
is the place from which to parse the information.
The trace values section provides the captured X and Y axes information to draw the graph.
The events section marks the time at which the events occur so they can be entered on the graph.
Summary of Contents for QB Expert
Page 8: ......
Page 23: ...Introduction Instruction Manual 15 ...
Page 24: ......
Page 36: ......
Page 37: ...3 QB Expert Alpha Controller Programming SETUP Area SERVICE Area ANALYZE Area ...
Page 94: ......
Page 109: ...Instruction Manual 101 ...
Page 110: ......
Page 123: ...Instruction Manual 115 Tool Operation ...
Page 124: ......
Page 132: ...Input and Output Connector QB Expert Alpha Controller 124 Inputs example ...
Page 133: ...Controller Connections Instruction Manual 125 Outputs Sourcing example ...
Page 157: ...Controller Connections Instruction Manual 149 ...
Page 158: ...MODBUS TCP QB Expert Alpha Controller 150 ...
Page 175: ...Embedded PLC Instruction Manual 167 ...
Page 176: ......
Page 183: ...Multiple Spindle Instruction Manual 175 ...
Page 184: ... QB Expert Alpha Controller 176 ...
Page 201: ...Instruction Manual 193 Maintenance ...
Page 202: ...QB Expert Alpha Controller 194 ...
Page 203: ...10 QB Expert Alpha Controller Appendix A Torsion Compensation Angle Validation ...
Page 206: ......
Page 207: ...11 QB Expert Alpha Controller Glossary ...
Page 210: ......


