8
FAULT DIAGNOSIS
152
8020776/12AX / 2019-05-31|SICK
O P E R A T I N G I N S T R U C T I O N S | Free Flow Profiler
Subject to change without notice
8.3.1.4
Analyzing the error situation
Narrow down the system fault by visualizing the measurement points.
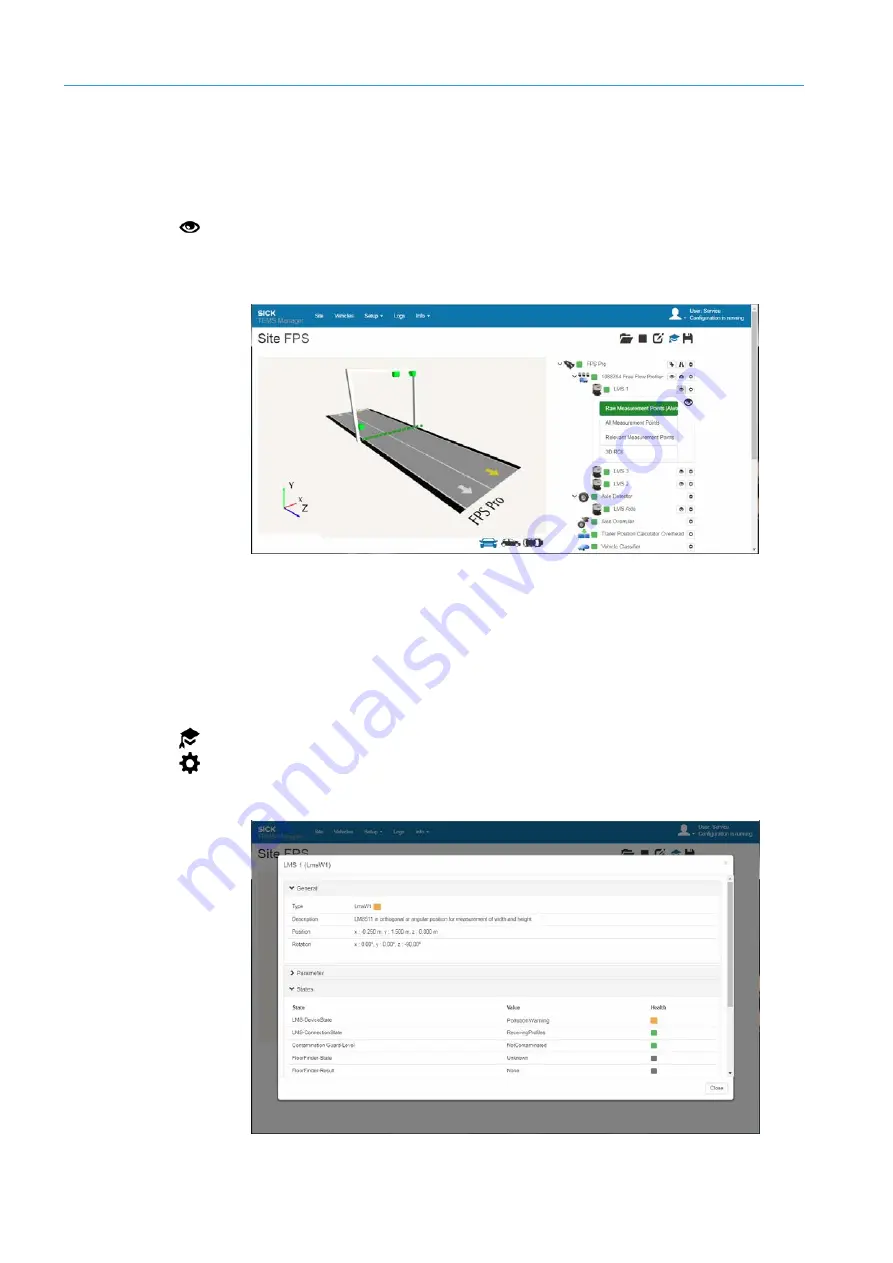
Visualizing the live data for the device component
1. Go to the device in the navigation tree and click the
Visualize live data for device
icon.
2. Click
Raw measuring points
. The live view in TEMS Manager shows the
unfiltered raw
data
for the 2D LiDAR sensor. You are able to see what the 2D LiDAR sensor can see in
its visual range.
▸
Click
Relevant Measurement Points
. The live view now shows the
filtered
measurement data
from the 2D LiDAR sensors. The filtered measurement data are
used as the basis for the 3D point cloud and the resulting calculations. Visualization of
the filtered measurement data helps to detect faults.
Showing the details
The detail window helps you narrow down the system fault even further. Other status
messages can also be accessed here.
1. Switch on expert mode.
▸
2. Go to the relevant device component level in the navigation tree and click the
Show
Details
icon. The detail window opens. The following example shows what the window
looks like when the
LMS 1
2D LiDAR sensors is contaminated.


