6
COMMISSIONING
118
8020776/12AX / 2019-05-31|SICK
O P E R A T I N G I N S T R U C T I O N S | Free Flow Profiler
Subject to change without notice
Updating the list
In the toolbar, there are two different options for updating the list of log entries.
▸
If you click on this icon, the list will be updated automatically. New log entries are
continuously added.
▸
Alternatively, you can update the log entries manually with this icon.
Filtering the list according to log entry type
▸
You can filter the list based on the following types:
Debug
,
Info
,
Warning
, and
Error
.
Click one of the four buttons to activate and deactivate the relevant filter.
You can combine several filters.
Defining the level of detail for “Recorder” log type entries
You can define a different level of detail for the log entries in the
Recorder
log type.
Support will let you know which level of detail is required to provide further assistance.
1. Switch to editing mode using the
Edit default configuration
icon.
2. Expand the tree that contains the system functions.
3. Mark a system function or system component in the navigation area (here a 2D LiDAR
sensor) and click the
Show Details
icon.
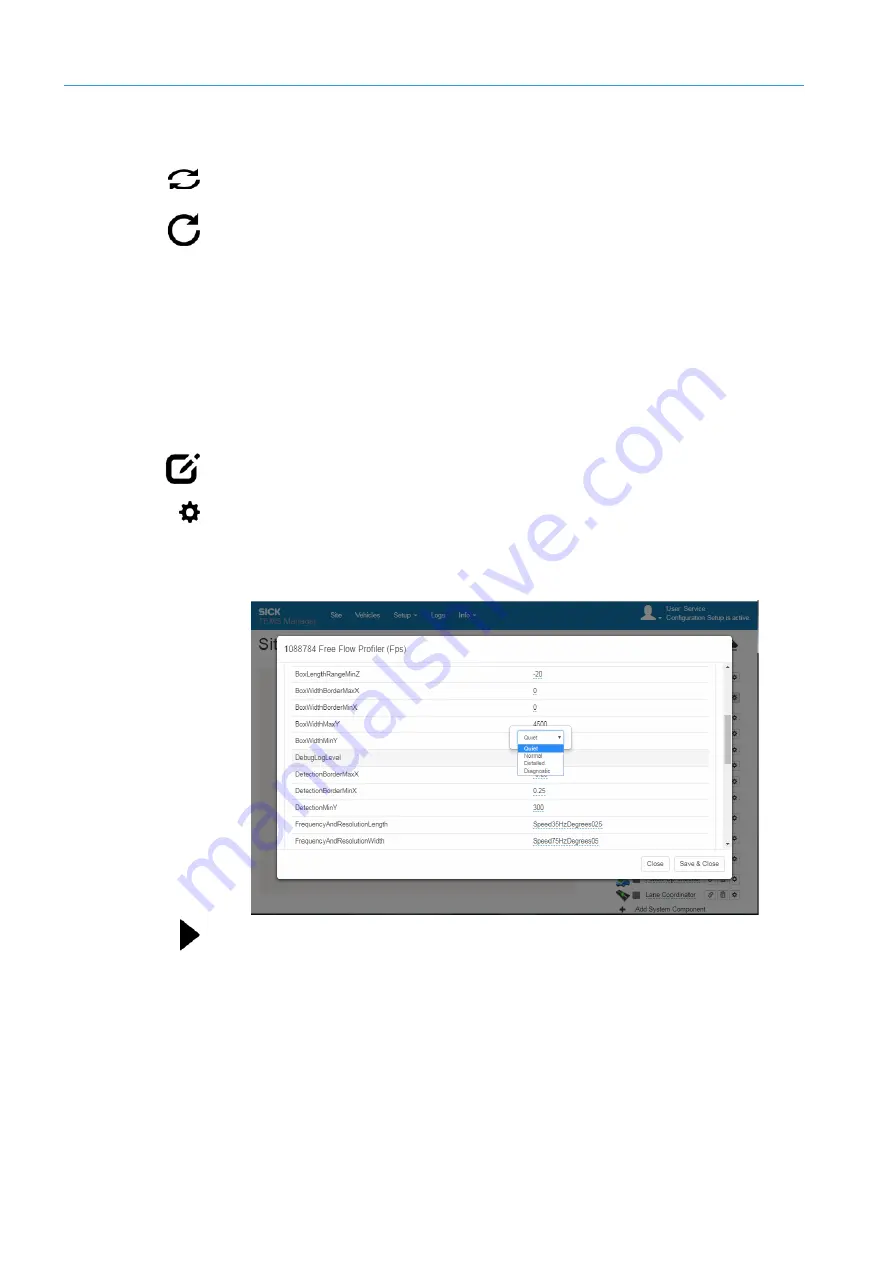
4. Select the level of detail advised by Support in the
DebugLogLevel
parameter. A
distinction is made between
Quiet
,
Normal
,
Detailed
, and
Diagnostics
detail levels.
5. Click the
Start site configuration
icon. All system actions are now written to the log file
of the
Recorder
type with the set level of detail.
Note


