25
© 2017 Proceq SA
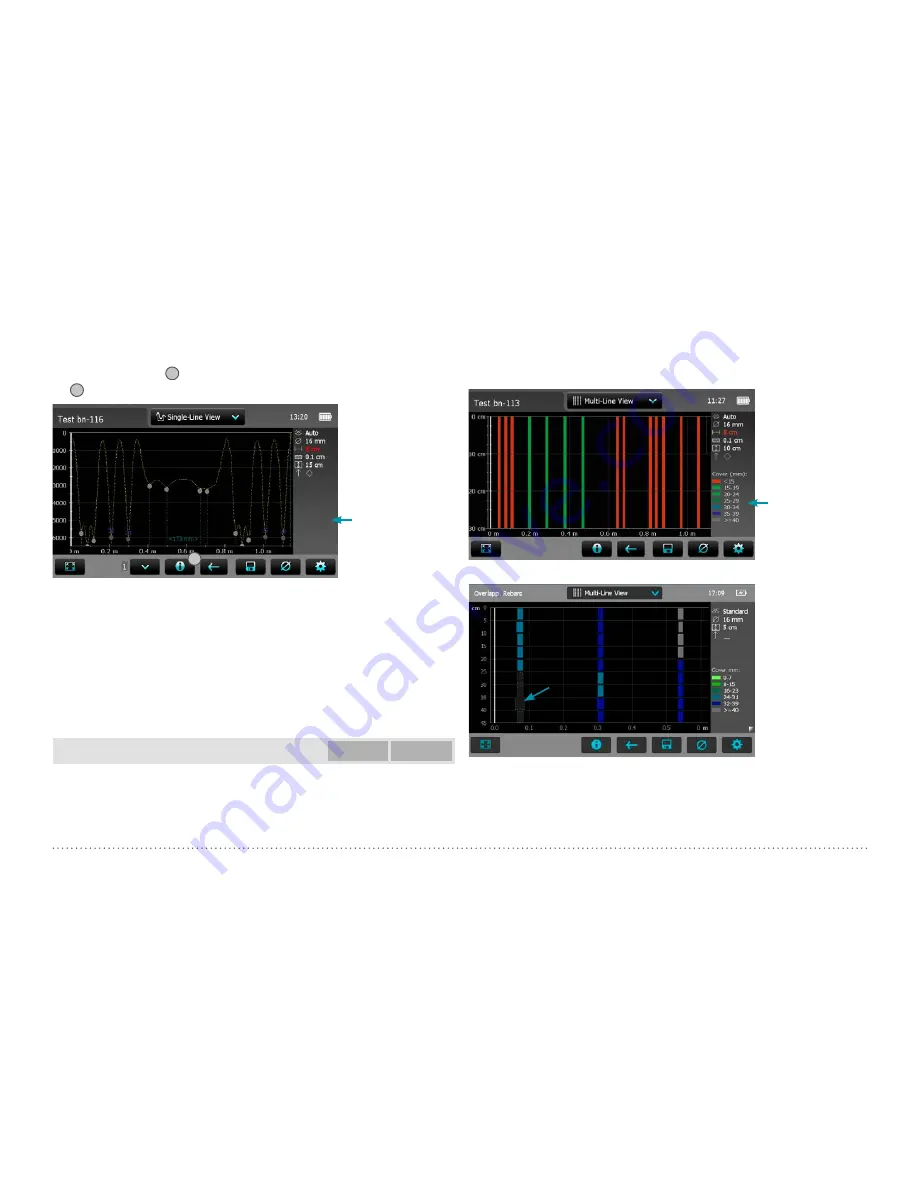
curve in yellow) set. The vertical axis shows the signal strength; hence
the Minimum Cover line is not shown.
It is a Single-Line View from measurements done in the Multi-Line View,
because at position
10
the
1
refers to the measuring row displayed. Tap
on
10
to display the Single-Line View of the next row.
10
Tap to switch among
different views.
Figure 21:
Single-Line View with Signal Strength Curve
The spacing among the rebars as well as the distance from the start line
to the first rebar and from the last rebar to the end line are displayed
as figures in the unit set, but only if the spacing on the screen is large
enough. If not shown zoom in until the figures appear.
For more details like changing a diameter or masking a rebar refer to
Single-Line Mode in chapter “3.2.2. Cover Meter Measurement Modes”.
To set a new diameter you may have to measure it first at the particular
location of the structure in the Locating Mode and set it manually.
Multi-Line View
Profometer
630 AI
Profometer
650 AI
The Multi-Lline View can be displayed only if measurements have been
done and stored in the Multi-Line or Area-Scan Mode. It is a plan view, in
most cases of the first layer rebars. A Multi-Line View of the second layer –
main layer in columns and girders – may also be of interest. Rebars can be
masked and unmasked in the corresponding Single-Line View (see “3.2.2.
Cover Meter Measurement Modes”); masked rebars will be displayed in
dark grey with a dotted line and their cover values will not be taken into
account in the Statistical View.
Tap to switch among
different views.
Figure 22:
Multi-Line View with cover values displayed
Masked rebars
Figure 23:
Multi-Line View with masked rebars


