© 2017 Proceq SA
40
4.2.4. Corrosion Display Views
Measured data can be displayed in five different views: Corrosion-Scan
View, Distribution View, Cumulative Distribution View, Chipping Graph
View, Chipping Graph ASTM. All the settings stored with the measure-
ments can be changed afterwards. The views will change accordingly; to
store the measuring series with the changes tap Store.
NOTE! Each View can be changed in a measuring mode in
order to add data. Tap on
. Set the cursor to the new
starting position and continue with the measurements (see
“4.2.3 Corrosion Measurement Modes”). All data and set-
tings will be stored in the reopened file.
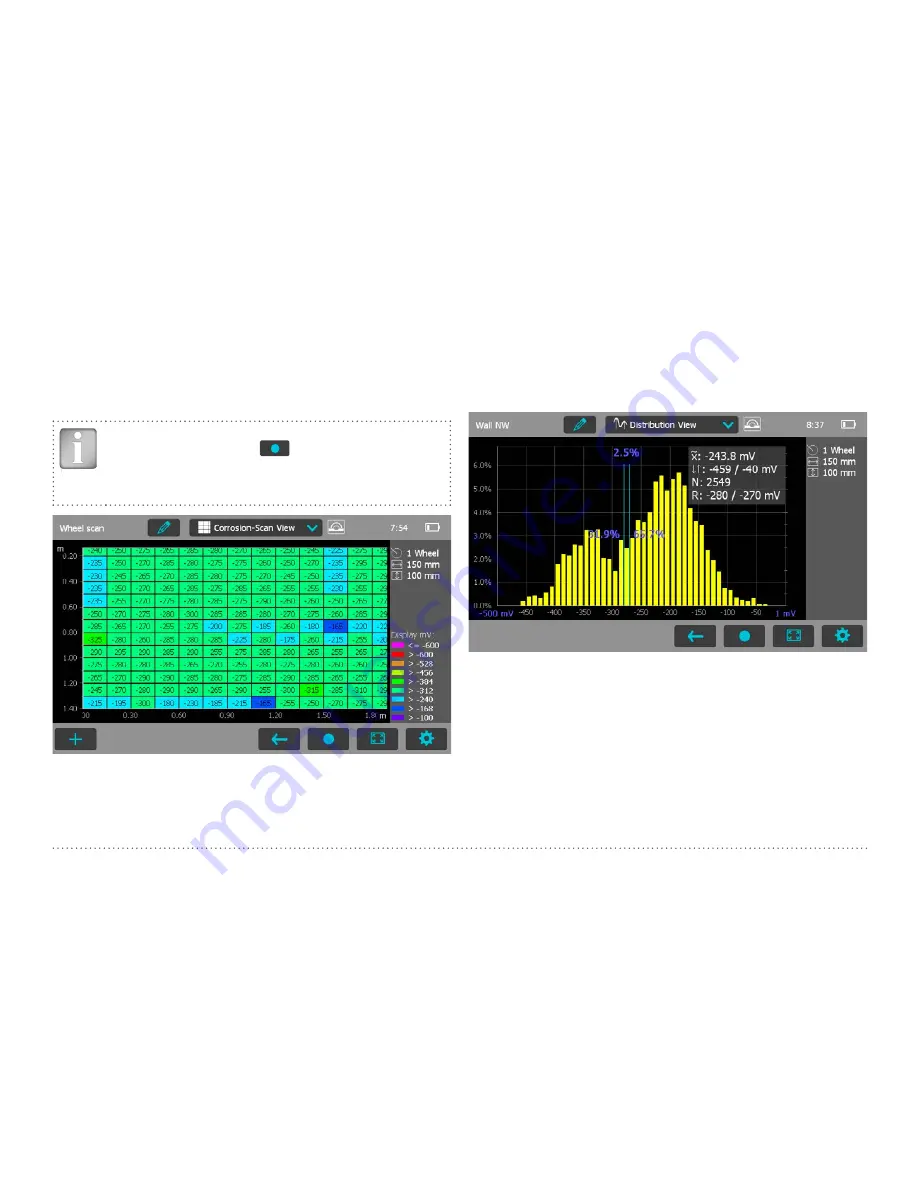
Figure 38:
Corrosion-Scan View
The Corrosion-Scan View provides an area mapping of the measured po-
tential values. The cells where no potential value was measured are dis-
played in white. You can zoom and scroll to any desired location, change
the color palette and the Potential Thresholds under Settings to enhance
the readability and highlight the desired details. Text notes can be added
to any cell or group of cells as described in 4.2.3 Corrosion-Scan Meas-
urement Mode.
Distribution View
Figure 39:
Distribution View
On the horizontal axis the potential values are displayed; the vertical bars
show the percentage of the respective potential values measured and
stored; you can adjust the horizontal scale with the Zoom button. The
vertical cursor bar can be moved to any potential value; the figure on the
left of the cursor bar shows the percentage of measured values smaller
than the cursor position and the value on the right shows the percentage
of measured values larger than the cursor position. In the upper right cor-
ner the median, minimum and maximum values are displayed, together
with the number of measurements and the current interval set with the


