background image

© 2017 Proceq SA  

48

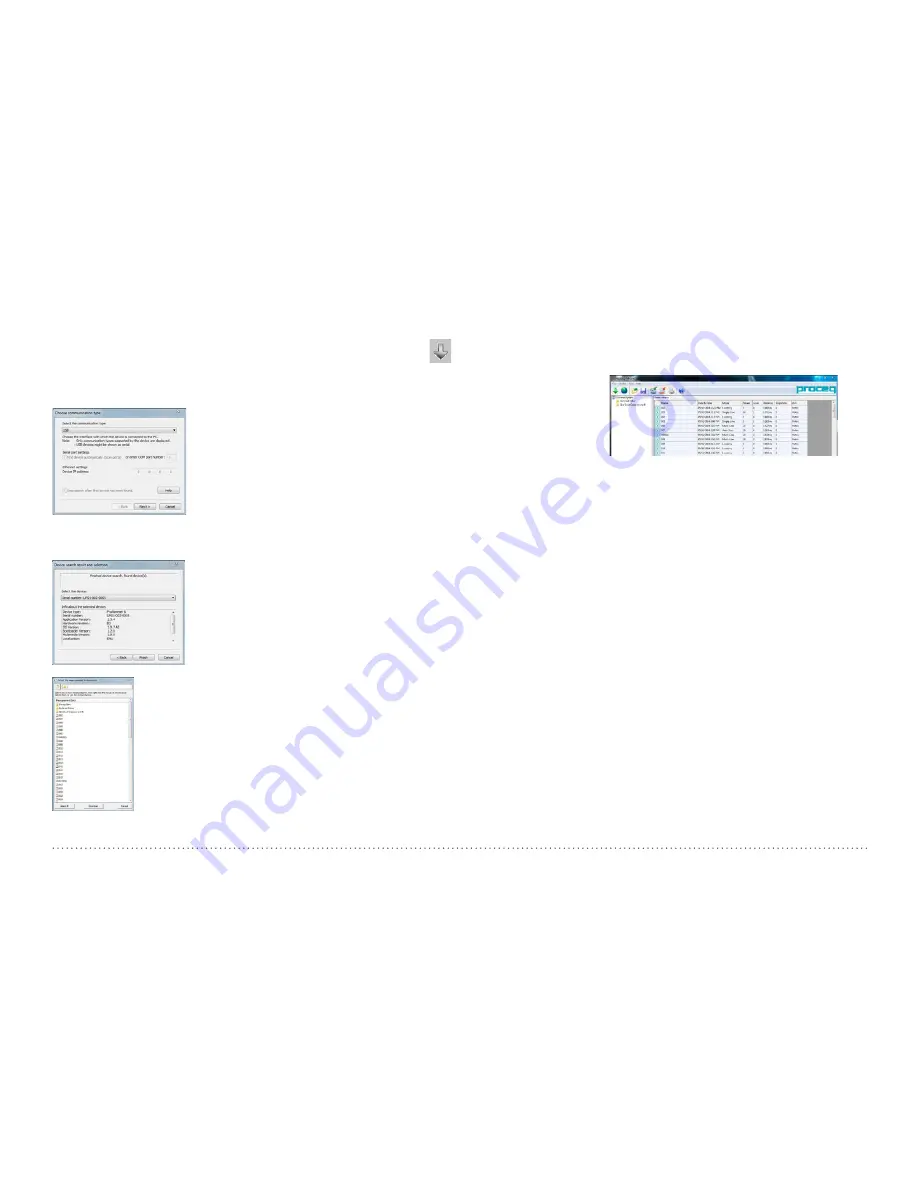
9.2  Connecting to a Profometer Touchscreen Unit

Connect the Profometer Touchscreen Unit to a USB port, then select 


to download data from the Profometer Touchscreen Unit.
The following window will be displayed: Select “USB” as the communica-
tion type. Click on “Next >”. 

When a Profometer Unit has been found its details will be displayed on 
screen. Click on the “Finish” button to establish the connection

Click on “Next >”. When a Profometer 
Touchscreen Unit has been found its de-
tails will be displayed on screen. Click 
on the “Finish” button to establish the 
connection.

Measurement files stored on the device will be dis-
played as shown on the left; choose whether to 
see only Cover meter files, Corrosion files or both 
by flagging the related box on top of the window.

Select one or more measurements and click 
“Download”.

9.3  Viewing Cover Meter Data

The selected measurements on your Profometer Touchscreen Unit will be 
displayed on the screen:
• 

Click on a folder 
to access the files 
stored in it or to 
paste-in other 
files.

• 

Click on the double arrow icon in the first column to see more details.

By clicking on the respective colored words one can switch:
•  Among Views 

Snapshot, Statistics, Single-Line, Multi-Line, Area-

Scan and Cross-Line View.

•  In Statistics View, results are displayed either for the Scan-

X

 or Scan-

Y


(when measurements done in the Cross-Line Mode).

•  In Single-Line View, when measurements are obtained in the Cross-Line, 

Multi-Line and Area-Scan Mode, the Scan-

X

 and Scan-

Y

 results are dis-

played separately for each scan performed. Additionally the Cover curve, 
Signal Strength curve or no curve can be selected. When viewing the 
results with the Cover curve or Signal Strength curve, the rebar number, 
cover, traversed distance and diameter of the individual rebar can be dis-
played by setting the cursor on the rebar. By right clicking on the rebar, the 
user can Mask/Unmask or change the set diameter.

•  In Multi-Line and Cross-Line Views among Display Measurement 

Cov-

er, Diameter 

and 

Signal


Strength

. When Signal Strength is set, you 

may click on 

Sharpen

 and adjust the color spectrum with the 

O

- and 

G

- sliders.

•  Between Statistics 

Normal

 and 

DBV.

Settings can be changed except the ones used for measurements like 
Measuring Ranges, Display Inclined Rebars, Return to start on new Line, 
Line Height and Grid Width.

Summary of Contents for 39210001

Page 1: ...Made in Switzerland Design Patent Pending Made in Switzerland Operating Instructions...

Page 2: ...2017 Proceq SA 2 Scope of Delivery D K T C B E F G I A O N P L M U Q S R H J...

Page 3: ...33001004 A Carrying case B Profometer touchscreen C Battery complete D Power supply incl cables E USB cable F DVD with software and documentation G Documentation H Activation key I Carrying strap comp...

Page 4: ...Ordering Information 44 6 1 Units 44 6 2 Upgrades 44 6 3 Parts and Accessories 44 7 Technical Specifications 45 8 Maintenance and Support 46 8 1 Maintenance and Cleaning 46 8 2 Support Concept 47 8 3...

Page 5: ...ts Serious damage resulting from the effects of foreign bodies accidents vandalism and force majeure All information contained in this documentation is presented in good faith and believed to be corre...

Page 6: ...te charge requires 9h Instrument not operating Charging time is much longer if the instrument is in use An optional quick charger Part No 327 01 053 can be used to charge a spare battery or to charge...

Page 7: ...isplayed All functions are accessible directly via the touchscreen Return to the previous menu by pressing the back button or the return icon arrow at the top left of the touchscreen Measurement Selec...

Page 8: ...92 50 003 plus any possible upgrade to Profometer 630 AI or 650 AI In either case the corresponding functionality Cover Meter and or Corro sion will be available on the Platform depending on whether t...

Page 9: ...efore you start measuring 3 1 2 Calibrated Measuring with Profometer 6 The Profometer 6 is calibrated to measure on a normal rebar arrange ment which is an arrangement of non stainless steel rebars fa...

Page 10: ...re of influence Diameter 400 mm 16 inch Figure 5 Influence sphere Any ferromagnetic material within the sphere may have an influence on on the signal value e g during a reset 3 2 Cover Meter Operation...

Page 11: ...r 1 2 or Large Spot Range is set then the Neighboring Rebar Correction only taking into account 1st layer is automati cally applied The user can enter the spacing value manually or choose the Auto fun...

Page 12: ...es measured on the same surface to get the same color range for comparison purposes Cover Offset When a Cover Offset value is set the measured cover will be reduced by this value e g when a wooden or...

Page 13: ...ne ously the cursor jumps to the next line in Multi Line Area Scan and Cross Line Mode only B Short Measure diameter Long Zeroing D Measurement Center when Spot range is set MC Sp Measurement Center w...

Page 14: ...n horizontal surface on soffit 4 Settings switches to the settings menu 5 Rebar Diameter measuring of rebar diameter 6 Store measured data 7 Restart all data of current measurement are deleted 8 Actua...

Page 15: ...ranges indicat ed in Figure 3 for more details about diameter measurement see 3 2 4 Practical Hints Tap 6 to store the diameter and cover measurement Repeat this procedure at each rebar The saved data...

Page 16: ...e whole scan 11 Actual Cover 12 Distance to the nearest rebar 13 Nos Measured diameter 14 Skip distance 15 Skip button 16 Coils indicator 17 Speed bar 18 Minimum set cover value if set 19 Measured dia...

Page 17: ...olumn plus 107mm 4 2 inches for the cart and repo sition the cart at the other side of the column with the left wheels touching the column Tap on 15 A blue dotted line is set at the begin ning of the...

Page 18: ...accuracy depends on the test surface The accuracy of measurements done on a smooth concrete surface concrete poured in metallic shuttering is shown in the specifications see 7 Tech nical Specification...

Page 19: ...t the whole scan 12 Actual Cover 13 Distance to the nearest rebar 14 Nos Measured diameter 15 Skip distance 16 Skip button 17 Coils indicator 18 Speed bar NOTE It is advisable to locate the first and...

Page 20: ...n in the Statistics View the Single Line View the Multi Line View and also in the Snapshot View if at least one diameter was measured In the Multi Line View the signal strength spectrum can be seen in...

Page 21: ...s and the corresponding cover values will not be taken into account in the Statistical View Figure 15 Area Scan option to mask a field by double tapping on it Cross Line Mode Profometer 650 AI 1 2 3 4...

Page 22: ...ance to the nearest rebar 15 Nos Measured diameter 16 Skip distance 17 Skip button 18 Coils indicator 19 Speed bar The Cross Line Mode is used to display the rebars of the first and second layer arran...

Page 23: ...axis the cover values in the unit set are displayed The vertical bars show the percentage of the respective cover values meas ured and stored The vertical cursor bar can be moved to any cover value Th...

Page 24: ...able as pdf file on the Pro fometer Touchscreen under Information Documents and in the download section of www proceq com Single Line View Profometer 630 AI Profometer 650 AI The Single Line View can...

Page 25: ...r refer to Single Line Mode in chapter 3 2 2 Cover Meter Measurement Modes To set a new diameter you may have to measure it first at the particular location of the structure in the Locating Mode and s...

Page 26: ...AI The Area Scan View is in fact a simplified Multi Line View which only shows the lowest cover values in a predefined grid It is mainly used in combination with potential field measurements e g comb...

Page 27: ...re shown Left of it s the value of the SX scanning in X direction of the rebars running in Y direction right of it s the value of the SY scanning in Y direction of the rebars running in X direction Ei...

Page 28: ...llel rebars is between 5 cm and 13 cm 2 0 to 5 2 set the respective Neighboring Rebar Correction value first Measure the diameter and use the derived value as setting for cover measurement NOTE The De...

Page 29: ...the rebars by rotating the probe slowly and searching for the maximum signal Welded Meshes The instrument cannot detect whether the rebars are welded to one an other or connected with binding wires Th...

Page 30: ...Measuring Principle 4 1 1 Corrosion and Half cell Potential Under normal conditions reinforcement steel is protected from corrosion by a thin passive film of hydrated iron oxide This passive film is...

Page 31: ...of corrosion rises with low negative po tentials active corrosion can be expected at locations where a negative potential is surrounded by increasingly positive potentials i e locations with a positi...

Page 32: ...e scribed in the previous paragraph Electrical resistivity of the concrete In order to measure the potential there must be a contact between the probe and the ectrolytes in the pore system of the conc...

Page 33: ...e with the Rod Electrode this can be done by using a tape or by drawing the grid on the element For large areas such as parking and bridge decks the wheel electrode is preferable The integrated path m...

Page 34: ...he Rod Electrode or the felt hoops on the wheel electrode are sufficiently mois tened In this case when making a measurement the probe must be held against the surface until a stable end value is reac...

Page 35: ...ed values of 50mV will be acquired automati cally once the value has stabilized If automatic measuring is not selected then values have to be acquired manually In both cases values 50mV have to be acq...

Page 36: ...nt window and the displayed settings depend on whether a Rod or Wheel electrode is selected as Probe Type NOTE In case measuring data shall be stored create a folder in the Explorer see 5 Explorer Doc...

Page 37: ...e On Off tap on screen to confirm Move to next cell Measurement procedure The cursor begins by default in the top left hand corner of the screen Press 6 to start the measurement sequence Moisten the f...

Page 38: ...d on this last number 2 Interface box connected current time battery status 3 Display of selected Settings Probe Type Grid X Spacing Grid Y Spacing Grid Limits if set Zoom in by placing thumb and inde...

Page 39: ...cursor will move to the next line at zero or current position depending on what defined in Settings under Direction of Next Line At the beginning of each line for the first 100 cm 40 inch the default...

Page 40: ...dis played in white You can zoom and scroll to any desired location change the color palette and the Potential Thresholds under Settings to enhance the readability and highlight the desired details T...

Page 41: ...e curve will typically exhibit a central region with a lower gradient more flat The two points where the gradient changes can be marked on the screen by dragging the two vertical cursors The red curso...

Page 42: ...ds Chipping Graph ASTM Figure 42 Chipping Graph ASTM NOTE It is always advisable to perform direct visual check on open locations in order to confirm refine the expected corrosion potential thresholds...

Page 43: ...folder or a specific folder was only created after the files have been stored in the main level Below the subfolder Inclined Rebar is open Name of folder in the main level only is shown Tap on the fir...

Page 44: ...handle encoder cables spare parts tool kit copper sulphate 250g citric acid 250g 330 01 004 Profometer Corrosion four wheel electrode with telescopic handle encoder cables spare parts tool kit copper...

Page 45: ...for Profo meter Corrosion including spade terminal adapter for third party electrodes 327 01 053 Quick Charger external 356 00 082 Display antiglare protection film for touchscreen unit 7 Technical S...

Page 46: ...rvice interval based on his or her own experience and usage Do not immerse the instrument in water or other fluids Keep the housing clean at all times Wipe off contamination using a moist and soft clo...

Page 47: ...lectric appliances together with household waste is not permissible In observance of European Directives 2002 96 EC 2006 66 EC and 2012 19 EC on waste electrical and electronic equipment and its imple...

Page 48: ...in the first column to see more details By clicking on the respective colored words one can switch Among Views Snapshot Statistics Single Line Multi Line Area Scan and Cross Line View In Statistics V...

Page 49: ...be edited see 4 2 2 Corrosion Settings Unit Potential Max Threshold Highest Potential Min Threshold Lowest Potential Range Palette Minimum Passive Limit Maximum Active Limit 9 5 Editing and moving dat...

Page 50: ...the measurement object you wish to export It will be highlighted as shown Click on the Export as CSV file s icon The data are exported as a Microsoft Office Excel comma separated file or files The ex...

Page 51: ...restraints apply The file to be added has to have the same x and y grid size after rotation of the previous one s The insert coordinate X and Y has to lay on a grid point it has to be a multiple of x...

Page 52: ...10 1 250 32 29 29 11 1 375 35 32 32 35 35 12 1 500 38 35 35 36 36 38 38 37 37 38 38 39 39 40 40 10 2 Appendix A2 Neighboring Bar Correction Following rebar spacings can be selected Metric Imperial cm...

Page 53: ...te Ltd 12 New Industrial Road 02 02A Morningstar Centre Singapore 536202 Phone 65 6382 3966 Fax 65 6382 3307 info asia proceq com Proceq Rus LLC Ul Optikov 4 korp 2 lit A Office 410 197374 St Petersbu...

Reviews: