33
Note
: Apply pressure on the virtual test points according to values specified in the following table.
Table 13 Test Point Pressure Values
System Size (inches)
Pressure (Kg)
20
1
40
5
60
10
Verify that the
signal
drop
received in the
Scope
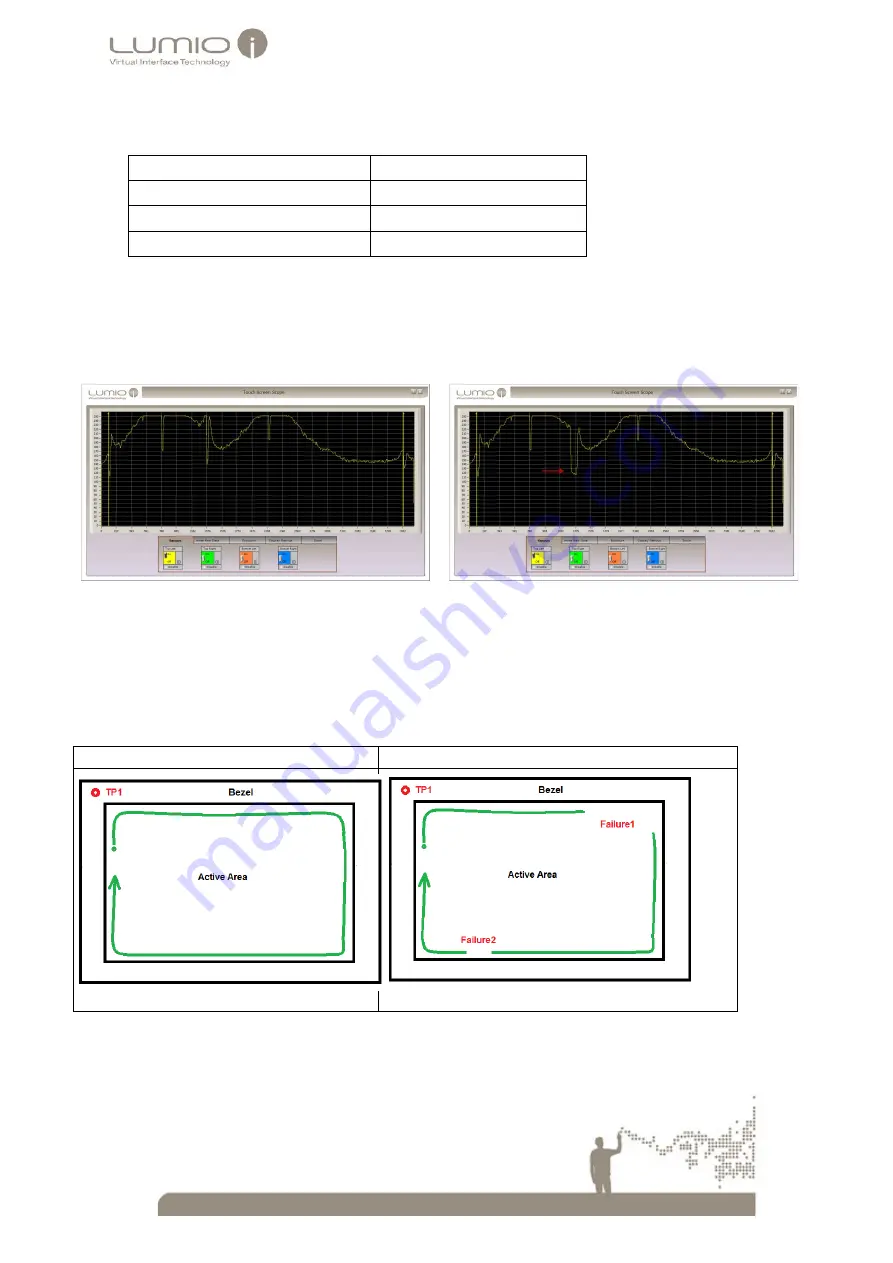
window while performing the test is larger than 20 units on the
Y axis.
The following windows display scope signals before pressing the test point on the bezel, and scope signals
received while pressing the test point on the bezel.
Figure 32 Scope Window – before touching Test Point Figure 33 Scope Window – Signal drop while touching Test Point
6.
Open Microsoft Paint.
7.
Draw a continuous rectangle on the Touch Screen
(while maintaining pressure on TP1).
The following windows display successful and unsuccessful coverage tests. The test is successful, that is, there is
full coverage, when the line drawn is continuous as displayed in
below. The test fails, if the line drawn
is broken as displayed in
Figure 34 Successful Integration Test
Figure 35 Failed Integration Test
8.
Repeat steps 5-7 for all virtual Touch Points (see Figure 31 above)


